| Fire incidents reported |
|---|
| Sreet name | Count |
|---|
| HIGHWAY 5 | 94 | | HIGHWAY 27 | 78 | | ROOPVILLE VEAL RD | 44 | | NEEDMORE RD | 38 | | GLENLOCH RD | 32 | | OLD HIGHWAY 27 | 28 | | BONNER GOLDMINE RD | 20 | | OLD CARROLLTON RD | 20 | | LEPARD RD | 16 | | CRAVEN RD | 14 | | MILLIGAN CREEK RD | 14 | | SPEARMAN RD | 14 | | WEST DR | 14 | | GUM CREEK RD | 12 | | REID ST | 12 | | OLD LOWELL MILL RD | 10 | | GRICE RD | 8 | | HESTER RD | 8 | | LIBERTY CHURCH RD | 8 | | OAK GROVE RD | 8 | | TUMLIN CRK RD | 8 | | BANKS CIR | 6 | | GUM CREEK AIRPORT RD | 6 | | GUM CREEK CIR | 6 | | HOPEWELL RD | 6 |
| | | Fire incidents reported |
|---|
| Sreet name | Count |
|---|
| RINGER RD | 6 | | WELCOME RD | 6 | | WHITEHEAD RD | 6 | | BETHESDA CHURCH RD | 4 | | HILL TOP RD | 4 | | HILLTOP LN | 4 | | HILLTOP RD | 4 | | HWY 27 S HWY | 4 | | OAK GROVE CHURCH RD | 4 | | OLD COLUMBUS RD | 4 | | OLD GOSHEN CHURCH RD | 4 | | ROOKS RD | 4 | | STARPOINT RD | 4 | | STONEY POINT RD | 4 | | THOMAS ST | 4 | | THOMAS WILSON RD | 4 | | 100 HWY | 2 | | ALABAMA RD | 2 | | ATTAWAY RD | 2 | | AVERY RD | 2 | | BIG OAK RD | 2 | | BOWDON TYUS RD | 2 | | CAVENDER CREEK RD | 2 | | DAVIS LN | 2 | | DENNY RD | 2 |
|
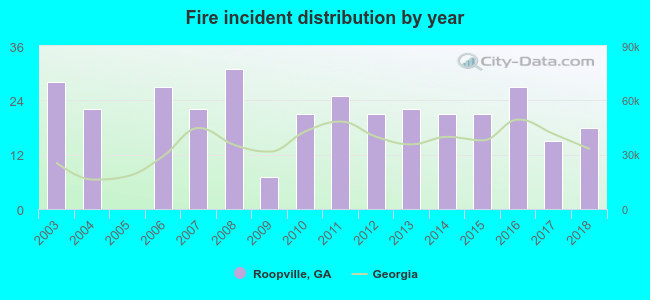 According to the data from the years 2003 - 2018 the average number of fires per year is 21. The highest number of reported fire incidents - 31 took place in 2008, and the least - 0 in 2005. The data has a declining trend.
 26.1% incidents where reported in the morning and 73.9% in the evening. The most fires (16.4%) took place on Wednesday, and the least (12.8%) on Friday.
 According to the 329 fires from years 2003 - 2018 most fires (12.5%) took place during April, and the least (5.2%) in August.
 Out of all 1,604 cases reported during the years 2003 - 2018, the most belonged to the categories: Rescue & EMS (53.2%), Fire (20.5%), and Service Call (11.1%).
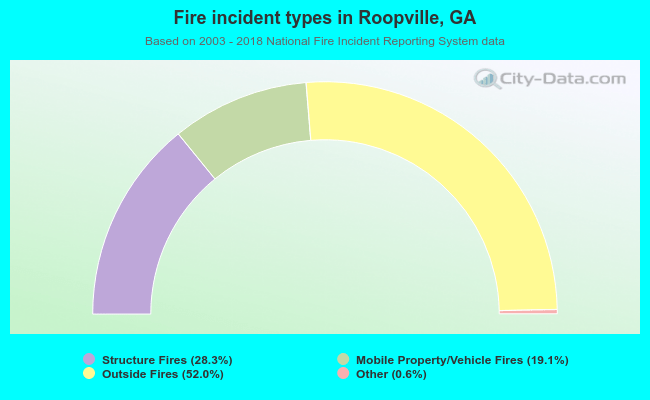 When looking into fire subcategories, the most incidents belonged to: Outside Fires (52.0%), and Structure Fires (28.3%).