Roodhouse: Fire Incidents, Illinois (IL)
Where are fire incidents reported in Roodhouse, IL
Something went wrong! Please refresh the page.
|
| |||||||||||||||||||||||||||||||||||||||||||||||||||||||||||||||||||||||||||||||||||||||||||||||||||||||||||||
| Other | 65 | |||||||||||||||||||||||||||||||||||||||||||||||||||||||||||||||||||||||||||||||||||||||||||||||||||||||||||||
2002 - 2018 National Fire Incident Reporting System (NFIRS) incidents
- Incident types reported to NFIRS in Roodhouse, IL
- 66460.4%Rescue & EMS
- 28726.1%Fire
- 817.4%Hazardous Condition
- 302.7%Service Call
- 151.4%Good Intent Call
- 121.1%Special Incident
- 60.5%False Alarm
- 20.2%Overpressure Rupture
- 20.2%Severe Weather
- Fire incident types reported to NFIRS in Roodhouse, IL
- 11439.7%Outside Fires
- 8830.7%Structure Fires
- 5619.5%Other
- 2910.1%Mobile Property/Vehicle Fires
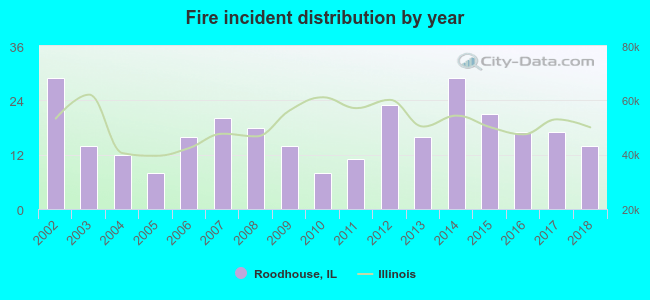 Based on the data from the years 2002 - 2018 the average number of fires per year is 17. The highest number of reported fire incidents - 29 took place in 2002, and the least - 8 in 2005. The data has a decreasing trend.
 27.5% incidents where reported in the morning and 72.5% in the evening. The most fires (17.1%) took place on Wednesday, and the least (11.1%) on Friday.
 Based on the 287 incident reports from years 2002 - 2018 most fires (19.2%) took place during March, and the least (4.2%) in November.
 Out of all 1,099 cases reported during the years 2002 - 2018, the most belonged to the categories: Rescue & EMS (60.4%), Fire (26.1%), and Hazardous Condition (7.4%).
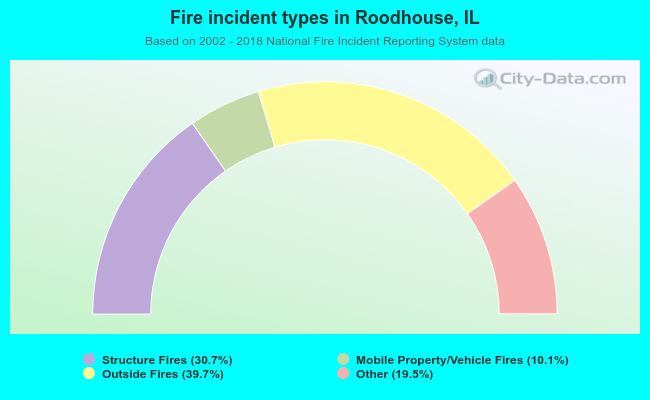 When looking into fire subcategories, the most incidents belonged to: Outside Fires (39.7%), and Structure Fires (30.7%).