Romeo: Fire Incidents, Michigan (MI)
Where are fire incidents reported in Romeo, MI
Something went wrong! Please refresh the page.
|
| |||||||||||||||||||||||||||||||||||||||||||||||||||||||||||||||||||||||||||||||||||||||||||||||||||||||||||||
| Other | 12 | |||||||||||||||||||||||||||||||||||||||||||||||||||||||||||||||||||||||||||||||||||||||||||||||||||||||||||||
2002 - 2018 National Fire Incident Reporting System (NFIRS) incidents
- Incident types reported to NFIRS in Romeo, MI
- 2,85980.7%Rescue & EMS
- 2567.2%Fire
- 1434.0%Hazardous Condition
- 1273.6%False Alarm
- 1133.2%Service Call
- 270.8%Good Intent Call
- 110.3%Special Incident
- 50.1%Severe Weather
- Fire incident types reported to NFIRS in Romeo, MI
- 10741.8%Structure Fires
- 8633.6%Outside Fires
- 4316.8%Mobile Property/Vehicle Fires
- 207.8%Other
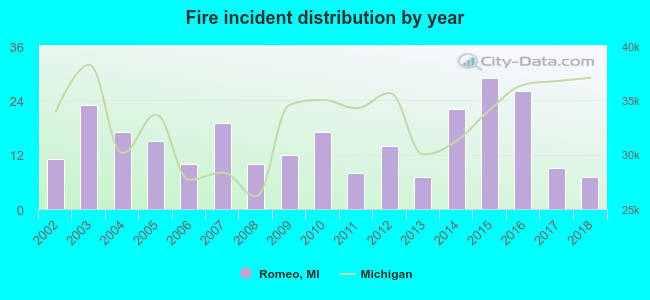 Based on the data from the years 2002 - 2018 the average number of fire incidents per year is 15. The highest number of fire incidents - 29 took place in 2015, and the least - 7 in 2013. The data has a declining trend.
 32.8% incidents where reported in the morning and 67.2% in the evening. The most fires (16.4%) took place on Friday, and the least (11.3%) on Monday.
 According to the 256 fire incidents from years 2002 - 2018 most fires (10.5%) took place during July, and the least (5.9%) in September.
 Out of all 3,542 cases reported during the years 2002 - 2018, the most belonged to the categories: Rescue & EMS (80.7%), Fire (7.2%), and Hazardous Condition (4.0%).
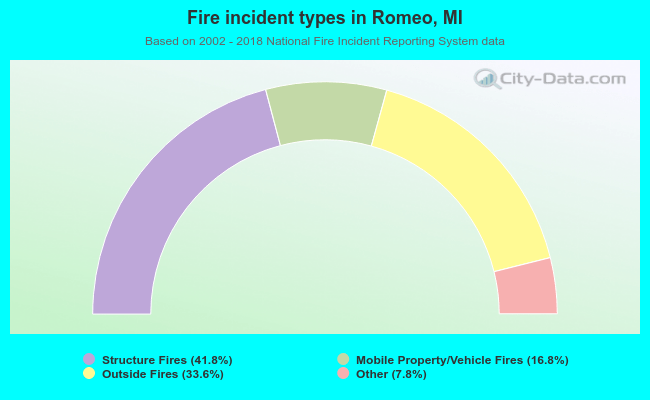 When looking into fire subcategories, the most reports belonged to: Structure Fires (41.8%), and Outside Fires (33.6%).