| Fire incidents reported |
|---|
| Sreet name | Count |
|---|
| LA HWY 1 | 38 | | HOSSTON RODESSA RD | 26 | | TYSON RD | 26 | | LA. 1 HWY | 20 | | MAIN ST | 20 | | MIRA MYRTIS RD | 18 | | RODESSA IDA RD | 18 | | CAPPS CITY RD | 16 | | FRONT ST | 16 | | MYRTIS TEXAS LINE RD | 16 | | FRENCH RD | 14 | | RODESSA STATE LINE RD | 14 | | BROADWELL RD | 12 | | LA 1 HWY | 12 | | RODESSA CEMETERY RD | 12 | | RODESSA CHURCH RD | 12 | | GODFREY RD | 10 | | HOUSE RD | 10 | | RODESSA CEMETARY RD | 10 | | UNITED GAS CO1 RD | 10 | | DODD ST | 8 | | ROBINSON ST | 8 | | RODESSA STATE LINE RD | 8 | | ADCOCK RD | 6 | | BUFFALO RD | 6 |
| | | Fire incidents reported |
|---|
| Sreet name | Count |
|---|
| HARRISON RD | 6 | | JOURNEY ST | 6 | | PENNOCK ST | 6 | | ATLANTA MIRA RD | 4 | | CAPPS CITY RD | 4 | | CYPRESS ST | 4 | | EMMONS DR | 4 | | HWY 168 | 4 | | LA HWY 168 | 4 | | MAGNOLIA RD | 4 | | RODESSA ST | 4 | | RODESSA STATE LINE R | 4 | | STANDARD OIL RD | 4 | | WILLIAMS ST | 4 | | WYNN SCHOOL RD | 4 | | ZYLKS RD | 4 | | BOIS D'ARC ST | 2 | | BREMER RD | 2 | | BREMMER RD | 2 | | BROWN CEMETERY RD | 2 | | CYPRESS ST | 2 | | DODD ST | 2 | | EMMONS RD | 2 | | FRENCH RD | 2 | | GIBSON RD | 2 |
|
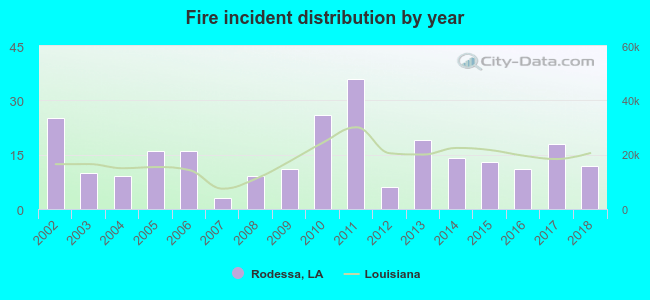 According to the data from the years 2002 - 2018 the average number of fire incidents per year is 15. The highest number of reported fires - 36 took place in 2011, and the least - 3 in 2007. The data has a decreasing trend.
 26.0% incidents where reported in the morning and 74.0% in the evening. The most fires (18.5%) took place on Friday, and the least (12.2%) on Sunday.
 Based on the 254 fire incidents from years 2002 - 2018 most fires (13.4%) took place during February, and the least (3.1%) in May.
 Out of all 768 cases reported during the years 2002 - 2018, the most belonged to the categories: Rescue & EMS (48.8%), Fire (33.1%), and Hazardous Condition (6.0%).
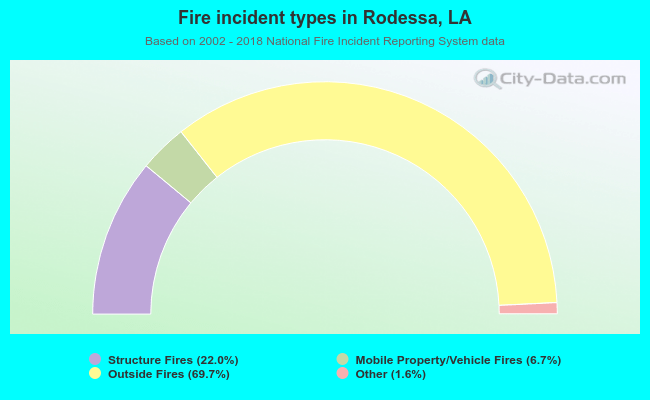 When looking into fire subcategories, the most incidents belonged to: Outside Fires (69.7%), and Structure Fires (22.0%).