| Fire incidents reported |
|---|
| Sreet name | Count |
|---|
| KINGWOOD RD | 26 | | BROADWAY ST | 14 | | CHIPPEWA RD | 14 | | NEW CENTERVILLE RD | 12 | | SCULLTON RD | 10 | | MAIN ST | 8 | | 139 ONYX LANE | 6 | | BARRON CHURCH RD | 6 | | BRIDGE ST | 6 | | CHICKENTOWN RD | 6 | | COPPER KETTLE HWY | 6 | | COUNTY LINE RD | 6 | | GARDNER RD | 6 | | GARRETT RD | 6 | | KINGWOOD RD | 6 | | 3040 GARRETT RD | 4 | | BAKERSVILLE EDIE RD | 4 | | BOGNAR RD | 4 | | CASSELMAN RD | 4 | | CROSS RD | 4 | | HARVEST DR | 4 | | HAUGER RD | 4 | | INDIAN CREEK VALLEY RD | 4 | | JUDY RD | 4 | | KIMMEL LN | 4 |
| | | Fire incidents reported |
|---|
| Sreet name | Count |
|---|
| KING RD | 4 | | KINGWOOD ROAD | 4 | | KLINK HOLLOW RD | 4 | | MIDDLECREEK RD | 4 | | MUD | 4 | | RED BIRD LN | 4 | | SANDY RUN RD | 4 | | TURKEY FOOT TRAIL RD | 4 | | WATER LEVEL RD | 4 | | WATER LEVEL RD | 4 | | WATER LEVEL ROAD | 4 | | 137 E SANNER ST | 2 | | 140 STORK RD | 2 | | 147 SANNER RD | 2 | | 148 FAIDLEY RD | 2 | | 172 BERKLEY RD | 2 | | 174 RASBERRY LANE | 2 | | 1762 CHICKENTOWN RD | 2 | | 194 RESERVOIR RD | 2 | | 197 COUNTRY CRONER LA | 2 | | 198 WEBB LN | 2 | | 204 BOGNAR ROAD | 2 | | 2055 MARKELTON SCHOOL RD | 2 | | 215 TOTACO TRAIL | 2 | | 222 CARDINAL RD RD | 2 |
|
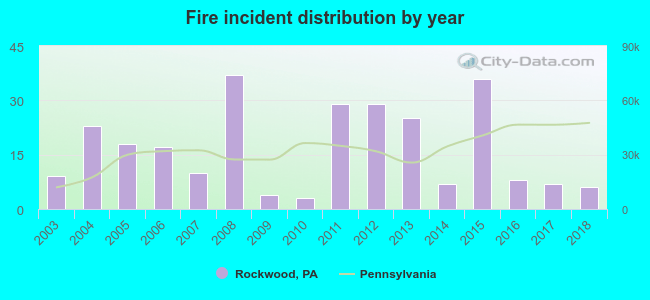 Based on the data from the years 2003 - 2018 the average number of fires per year is 17. The highest number of fires - 37 took place in 2008, and the least - 3 in 2010. The data has a dropping trend.
 41.4% incidents where reported in the morning and 58.6% in the evening. The most fires (16.4%) took place on Wednesday, and the least (11.2%) on Friday.
 According to the 268 fires from years 2003 - 2018 most fires (13.1%) took place during April, and the least (4.5%) in August.
 Out of all 512 cases reported during the years 2003 - 2018, the most belonged to the categories: Fire (52.3%), Rescue & EMS (19.7%), and Hazardous Condition (12.3%).
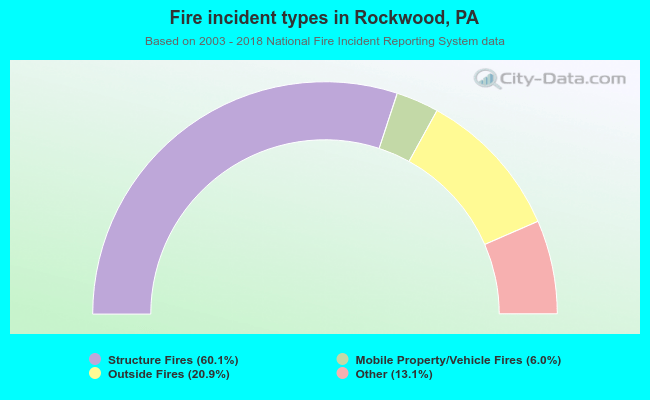 When looking into fire subcategories, the most incidents belonged to: Structure Fires (60.1%), and Outside Fires (20.9%).