Rochester: Fire Incidents, Washington (WA)
Where are fire incidents reported in Rochester, WA
Something went wrong! Please refresh the page.
|
| |||||||||||||||||||||||||||||||||||||||||||||||||||||||||||||||||||||||||||||||||||||||||||||||||||||||||||||
2002 - 2018 National Fire Incident Reporting System (NFIRS) incidents
- Incident types reported to NFIRS in Rochester, WA
- 5,70759.3%Rescue & EMS
- 1,79418.7%Fire
- 96810.1%Good Intent Call
- 4915.1%Service Call
- 3193.3%False Alarm
- 2913.0%Hazardous Condition
- 390.4%Special Incident
- Fire incident types reported to NFIRS in Rochester, WA
- 92351.4%Outside Fires
- 56131.3%Structure Fires
- 22012.3%Mobile Property/Vehicle Fires
- 905.0%Other
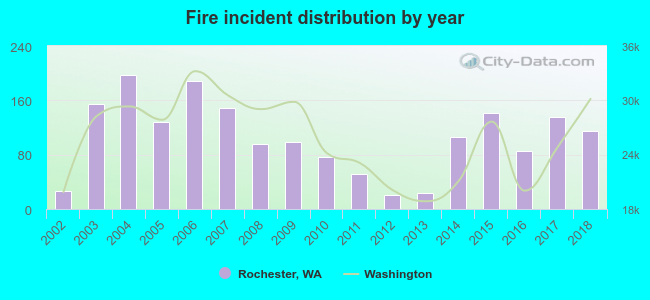 According to the data from the years 2002 - 2018 the average number of fires per year is 106. The highest number of fires - 198 took place in 2004, and the least - 21 in 2012. The data has a growing trend.
 The median response time based on all reported fire incidents is 9 minutes. This is higher compared to the state median value.
The median response time in Rochester, WA compared to nearest cities:
(Note: Based on data for all years, including only cities with at least 500 fire incidents)
| Rochester: | 9 minutes |
| Centralia: | 6 minutes |
| Tenino: | 10 minutes |
| Chehalis: | 7 minutes |
| Tumwater: | 7 minutes |
| Olympia: | 7 minutes |
| Lacey: | 6 minutes |
| Elma: | 10 minutes |
| Yelm: | 10 minutes |
 25.2% incidents where reported in the morning and 74.8% in the evening. The most fires (16.1%) took place on Wednesday, and the least (11.4%) on Thursday.
 According to the 1,794 reports from years 2002 - 2018 most fires (20.8%) took place during July, and the least (3.8%) in January.
 Out of all 9,618 cases reported during the years 2002 - 2018, the most belonged to the categories: Rescue & EMS (59.3%), Fire (18.7%), and Good Intent Call (10.1%).
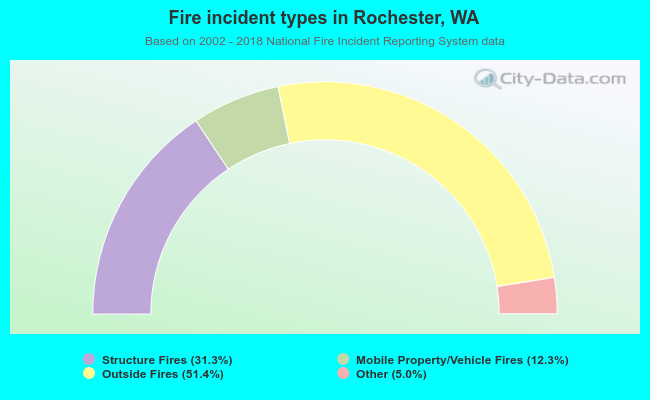 When looking into fire subcategories, the most reports belonged to: Outside Fires (51.4%), and Structure Fires (31.3%).