| Fire incidents reported |
|---|
| Sreet name | Count |
|---|
| CARDINAL HILL RD | 26 | | WALNUT STREET | 18 | | BUCKHART RD | 16 | | JOSTES RD | 16 | | BUCKHART ROAD | 14 | | CARDINAL HILL ROAD | 14 | | JOSTES ROAD | 14 | | STATE ROUTE 29 | 14 | | MAIN ST | 12 | | OAK ROAD | 12 | | GAULE RD | 10 | | MAIN | 10 | | MAIN STREET | 10 | | MECHANICSBURG ROAD | 10 | | PLEASANT LANE | 10 | | STATE ROUTE 29 HWY | 10 | | BOYD FARM RD | 8 | | BUCKHART | 8 | | GAULE ROAD | 8 | | LAKESERVICES RD | 8 | | LEACH RD | 8 | | LEACH ROAD | 8 | | OAK HILL RD | 8 | | RAMSEY RD | 8 | | WALNUT | 8 |
| | | Fire incidents reported |
|---|
| Sreet name | Count |
|---|
| WOODLAND TRL | 8 | | BOYD FARM ROAD | 6 | | CASCADE ROAD | 6 | | MILL | 6 | | MINDER ROAD | 6 | | MOTTAR RD | 6 | | NEW CITY RD | 6 | | NEW CITY ROAD | 6 | | OAK RD | 6 | | RAMSEY ROAD | 6 | | TAFT DR | 6 | | WALNUT ST | 6 | | WOODLAND TRAIL | 6 | | ARCHER ROAD | 4 | | BRANER ROAD | 4 | | BRECKENRIDGE ROAD | 4 | | CAMELOT DR | 4 | | CAMINO DE BURLON | 4 | | CARDINAL HILL RD | 4 | | CASCADE RD | 4 | | CRAVENS ROAD | 4 | | CUMBERLAND | 4 | | CUMBERLAND DR | 4 | | CUMBERLAND ST | 4 | | |
|
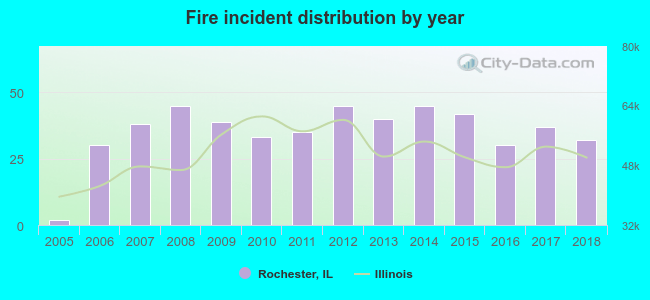 According to the data from the years 2005 - 2018 the average number of fire incidents per year is 35. The highest number of fires - 45 took place in 2008, and the least - 2 in 2005. The data has an increasing trend.
 26.3% incidents where reported in the morning and 73.7% in the evening. The most fires (20.0%) took place on Saturday, and the least (10.3%) on Wednesday.
 Based on the 494 fire incident reports from years 2005 - 2018 most fires (14.0%) took place during March, and the least (3.0%) in August.
 Out of all 2,192 cases reported during the years 2005 - 2018, the most belonged to the categories: Rescue & EMS (50.0%), Fire (22.5%), and Hazardous Condition (9.5%).
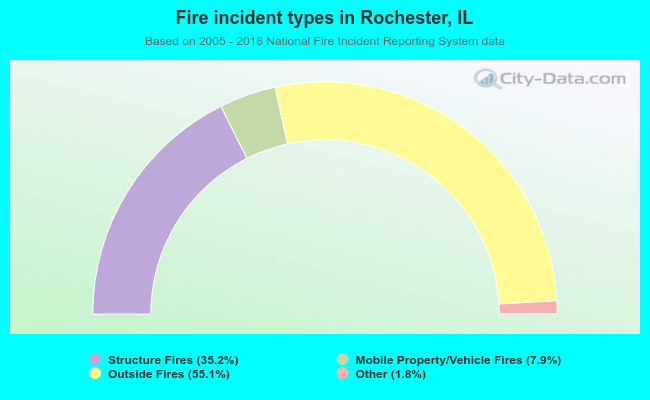 When looking into fire subcategories, the most incidents belonged to: Outside Fires (55.1%), and Structure Fires (35.2%).