| Fire incidents reported |
|---|
| Sreet name | Count |
|---|
| CHERRY ST | 18 | | MAIN ST | 18 | | FROSTY HOLLOW RD | 8 | | PAPERMILL RD | 8 | | PARK AVE | 8 | | WOODBURY PIKE | 8 | | BLOOMFIELD RD | 6 | | COVE LANE RD | 6 | | KENSINGER RD | 6 | | LAFAYETTE RD | 6 | | SAGE DR | 6 | | SPRUCE ST | 6 | | WATER ST | 6 | | WOODBURY PIKE | 6 | | BURKETTOWN RD | 4 | | CROSS COVE RD | 4 | | DICK SCHOOL HOUSE RD | 4 | | GIRARD ST | 4 | | MAIN STREET | 4 | | NASON DR | 4 | | OAK RIDGE DR | 4 | | ORCHARD RD | 4 | | ROARING SPRING CMNS | 4 | | SPROUL MOUNTAIN RD | 4 | | THE BARRENS RD | 4 |
| | | Fire incidents reported |
|---|
| Sreet name | Count |
|---|
| 705 GIRARD ST | 2 | | 114 PASTURE LN | 2 | | 167 SPROUL MOUNTAIN RD | 2 | | 306 E MAIN ST | 2 | | 3403 LAFAYETTE RD | 2 | | BEECH ST | 2 | | BURKET RD | 2 | | CARPER RD | 2 | | CHESTNUT ST | 2 | | COVE MOUNTAIN RD | 2 | | DANDELION DR | 2 | | DOGWOOD LN | 2 | | ERB RD | 2 | | FREDERICK RD | 2 | | GARFIELD RD | 2 | | GIIRARD ST | 2 | | GIRARD ST | 2 | | JOYES CT | 2 | | LAFAYETTE RD POTTER CREEK RD | 2 | | LAFEYETTE RD | 2 | | LOCUST ST | 2 | | MAIN STREET ST | 2 | | MOHRS LN | 2 | | ORE HILL RD | 2 | | |
|
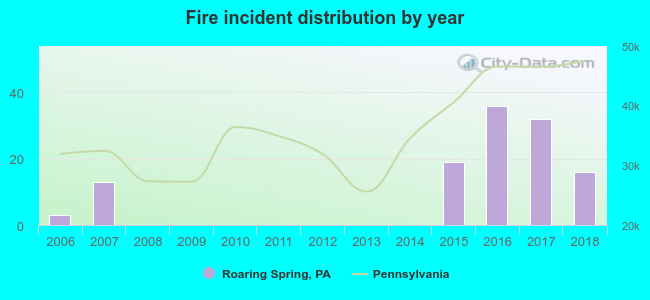 Based on the data from the years 2006 - 2018 the average number of fires per year is 9. The highest number of fires - 36 took place in 2016, and the least - 0 in 2008. The data has a growing trend.
 32.8% incidents where reported in the morning and 67.2% in the evening. The most fires (18.5%) took place on Monday, and the least (10.9%) on Sunday.
 According to the 119 fires from years 2006 - 2018 most fires (14.3%) took place during April, and the least (3.4%) in July.
 Out of all 582 cases reported during the years 2006 - 2018, the most belonged to the categories: Overpressure Rupture (36.8%), Fire (20.4%), and Rescue & EMS (20.4%).
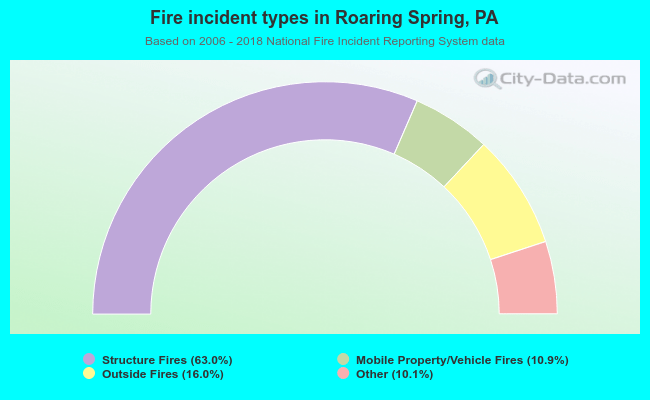 When looking into fire subcategories, the most incidents belonged to: Structure Fires (63.0%), and Outside Fires (16.0%).