| Fire incidents reported |
|---|
| Sreet name | Count |
|---|
| GREEN LAKE RD | 22 | | RIVERSIDE CUTOFF RD | 16 | | TUNK CREEK RD | 12 | | RIVER RD | 10 | | SEAHAWK DR | 10 | | JOHNSON CREEK RD | 8 | | KEYSTONE RD | 8 | | PHARR RD | 8 | | GREEN ACRES RD | 6 | | HWY 97 MILE POST 298 | 6 | | JOHNSON CRK RD | 6 | | GAY RD | 4 | | MAIN ST | 4 | | MILE POST 304 HWY | 4 | | PIONEER WY | 4 | | SEAHAWK DRIVE | 4 | | TUNK GRADE | 4 | | 105 TOWER STREET | 2 | | 203 B RIVERSIDE CUT-OFF | 2 | | 369 TUNK CREEK RD | 2 | | 3RD ST | 2 | | 40TH ST | 2 | | 425 MAGLOFLAN CANYON ROAD | 2 | | 56TH ST | 2 | | 66 AVE | 2 |
| | | Fire incidents reported |
|---|
| Sreet name | Count |
|---|
| 68TH AV | 2 | | 73 AVE | 2 | | 77 AVE | 2 | | ARMATAGE HILL RD RD | 2 | | ARMITAGE HILL RD | 2 | | BLUNKS TRAILER PARK | 2 | | CONCONULLY CUTOF ROAD | 2 | | COUNTY ROAD 280 | 2 | | CROFOOT LANE | 2 | | CROWFOOT LANE | 2 | | DIXION HILL ORCHARD | 2 | | DIXON HILL RD | 2 | | E DEER PARK MILAN RD | 2 | | EVANS LAKE RD | 2 | | GLENWOOD AVE | 2 | | GRANITERIDGE RD | 2 | | GREEBACRES ROAD | 2 | | GREENACRES RD | 2 | | GRIGGS ST | 2 | | HAPPY HILL RD | 2 | | HIGHWAY 97 | 2 | | HIGHWAY 97 HWY | 2 | | HOSHEIT RD | 2 | | HUBBARD RD | 2 | | HWY | 2 |
|
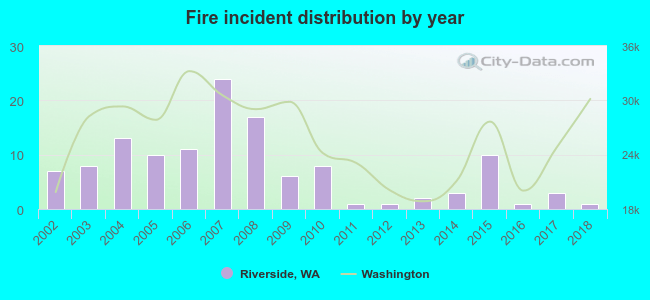 According to the data from the years 2002 - 2018 the average number of fires per year is 7. The highest number of fires - 24 took place in 2007, and the least - 1 in 2011. The data has a dropping trend.
 27.0% incidents where reported in the morning and 73.0% in the evening. The most fires (22.2%) took place on Tuesday, and the least (5.6%) on Monday.
 Based on the 126 fires from years 2002 - 2018 most fires (15.9%) took place during July, and the least (2.4%) in December.
 Out of all 192 cases reported during the years 2002 - 2018, the most belonged to the categories: Fire (65.6%), Overpressure Rupture (15.6%), and Service Call (13.0%).
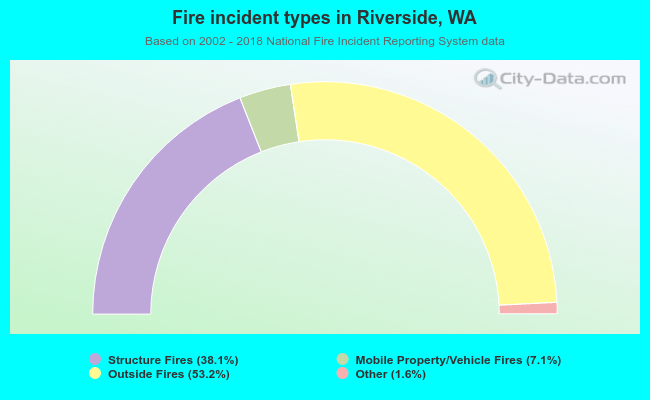 When looking into fire subcategories, the most reports belonged to: Outside Fires (53.2%), and Structure Fires (38.1%).