Ripley: Fire Incidents, Ohio (OH)
Where are fire incidents reported in Ripley, OH
Something went wrong! Please refresh the page.
|
| |||||||||||||||||||||||||||||||||||||||||||||||||||||||||||||||||||||||||||||||||||||||||||||||||||||||||||||
2002 - 2018 National Fire Incident Reporting System (NFIRS) incidents
- Incident types reported to NFIRS in Ripley, OH
- 27635.5%Fire
- 21427.5%Hazardous Condition
- 18323.5%Rescue & EMS
- 415.3%Service Call
- 314.0%Good Intent Call
- 202.6%False Alarm
- 111.4%Severe Weather
- 20.3%Special Incident
- Fire incident types reported to NFIRS in Ripley, OH
- 14954.0%Structure Fires
- 8129.3%Outside Fires
- 4516.3%Mobile Property/Vehicle Fires
- 10.4%Other
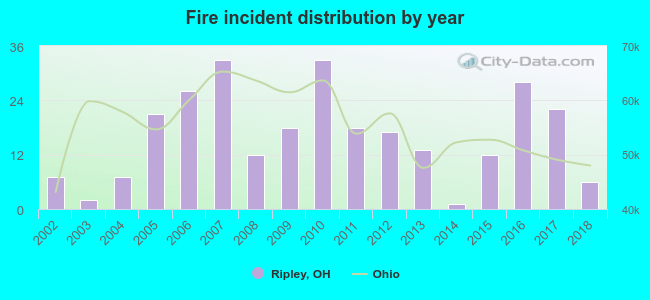 Based on the data from the years 2002 - 2018 the average number of fire incidents per year is 16. The highest number of fires - 33 took place in 2007, and the least - 1 in 2014. The data has a declining trend.
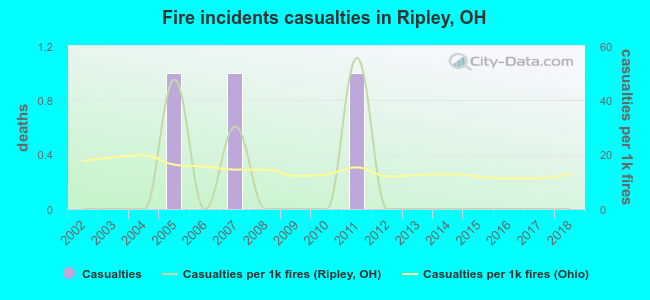 According to the data from the years 2002 - 2018 the average number of fire-related yearly casualties is 0. The highest number of reported casualties - 1 took place in 2005, and the lowest - 0 in 2002. The data has a constant trend.
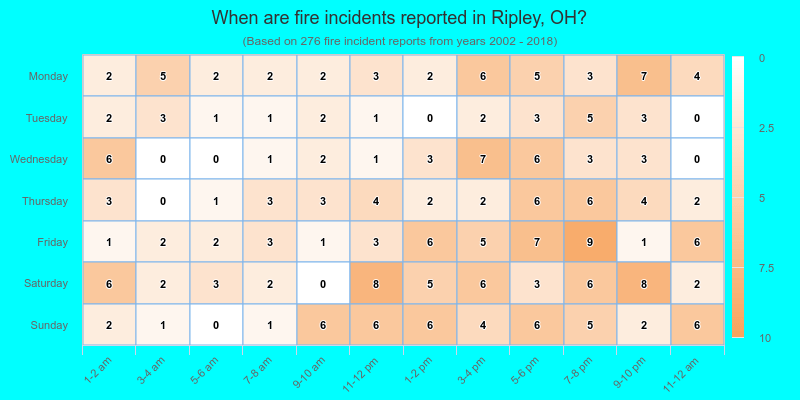
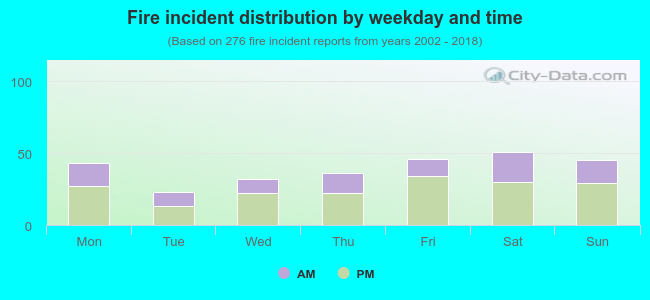 35.9% incidents where reported in the morning and 64.1% in the evening. The most fires (18.5%) took place on Saturday, and the least (8.3%) on Tuesday.
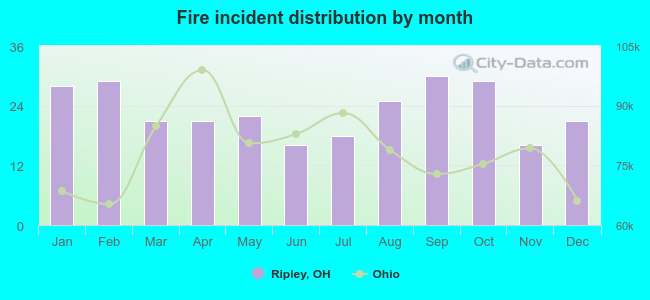 Based on the 276 fires from years 2002 - 2018 most fires (10.9%) took place during September, and the least (5.8%) in June.
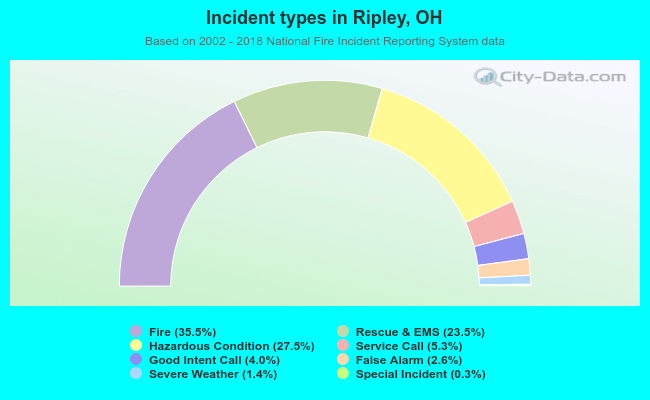 Out of all 778 cases reported during the years 2002 - 2018, the most belonged to the categories: Fire (35.5%), Rescue & EMS (27.5%), and Overpressure Rupture (23.5%).
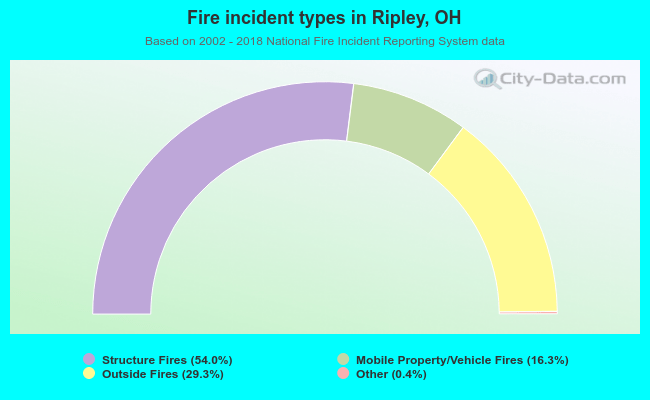 When looking into fire subcategories, the most incidents belonged to: Structure Fires (54.0%), and Outside Fires (29.3%).