| Fire incidents reported |
|---|
| Sreet name | Count |
|---|
| ROUTE 68 | 18 | | CHESNUT ST | 8 | | LAWSONHAM ROAD | 8 | | MADISON SHOP ROAD | 8 | | 5684 RT 68 | 4 | | 650 MAIN ST | 4 | | 73 ROCK LN | 4 | | CHERRY RUN ROAD | 4 | | CHESTNUT ST | 4 | | LAWSONHAM ROAD | 4 | | LAWSONHAM STREET | 4 | | MAIN ST | 4 | | MAPLE GROVE ROAD | 4 | | MONTEREY ROAD | 4 | | RIDER RD | 4 | | ROUTE 861 | 4 | | RT 861 | 4 | | SARAH FURNACE ROAD | 4 | | 1011 KISSINGER MILLS RD | 2 | | 1011 KISSINGER MILLS RD | 2 | | 135 FOWLER RD | 2 | | 145 SWITZER RD | 2 | | 1491 RT 68 | 2 | | 183 BAKER SCHOOL RD | 2 | | 21 FINK RD | 2 |
| | | Fire incidents reported |
|---|
| Sreet name | Count |
|---|
| 210 FINK RD | 2 | | 283 HENRY RD | 2 | | 305 MCNAUGHTEN RD | 2 | | 305 MCNAUGHTON RD | 2 | | 3122 TRAISTER ROAD | 2 | | 363 CHESTNUT ST | 2 | | 3944 SARAH FURNACE RD | 2 | | 437 MAPLE GROVE RD | 2 | | 4763 RT 861 | 2 | | 484 MAIN STREET | 2 | | 554 MAIN ST | 2 | | 623 CHERRY RUN RD | 2 | | 623 CHERRY RUN RD TOBY TWP | 2 | | 674 MAIN ST | 2 | | 804 MAIN STREET | 2 | | 817 LOBAUGH HILL ROAD | 2 | | 817 LOBAUGHHILL RD | 2 | | 854 MAIN STREET | 2 | | ACME ST | 2 | | AVENDALE LANE | 2 | | BACK STREET | 2 | | BAKER SCHOOL RD | 2 | | BAKER STREET | 2 | | BEST ROAD | 2 | | |
|
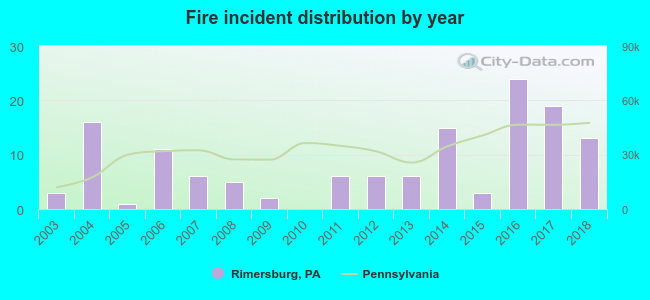 Based on the data from the years 2003 - 2018 the average number of fires per year is 9. The highest number of fires - 24 took place in 2016, and the least - 0 in 2010. The data has a growing trend.
 31.6% incidents where reported in the morning and 68.4% in the evening. The most fires (17.6%) took place on Sunday, and the least (11.0%) on Thursday.
 According to the 136 fires from years 2003 - 2018 most fires (24.3%) took place during April, and the least (2.2%) in August.
 Out of all 427 cases reported during the years 2003 - 2018, the most belonged to the categories: Fire (31.9%), Service Call (29.3%), and Rescue & EMS (15.0%).
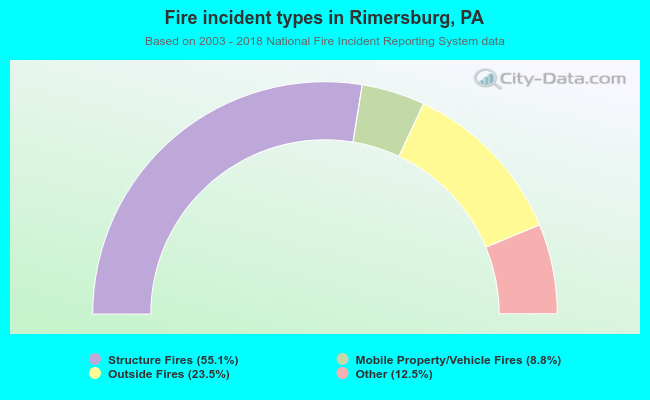 When looking into fire subcategories, the most incidents belonged to: Structure Fires (55.1%), and Outside Fires (23.5%).