Ridgely: Fire Incidents, Maryland (MD)
Where are fire incidents reported in Ridgely, MD
Something went wrong! Please refresh the page.
|
| |||||||||||||||||||||||||||||||||||||||||||||||||||||||||||||||||||||||||||||||||||||||||||||||||||||||||||||
2002 - 2018 National Fire Incident Reporting System (NFIRS) incidents
- Incident types reported to NFIRS in Ridgely, MD
- 76237.4%Fire
- 48623.8%Rescue & EMS
- 32616.0%Good Intent Call
- 30915.2%Hazardous Condition
- 773.8%Service Call
- 743.6%False Alarm
- Fire incident types reported to NFIRS in Ridgely, MD
- 49565.0%Structure Fires
- 19024.9%Outside Fires
- 455.9%Mobile Property/Vehicle Fires
- 324.2%Other
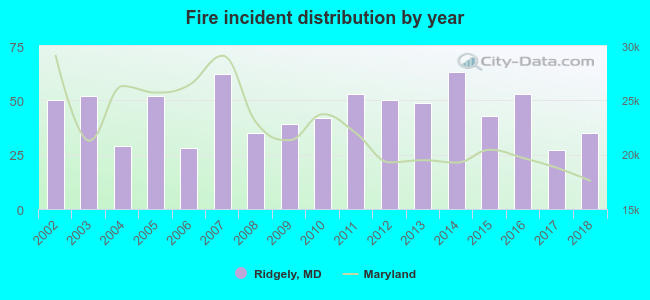 Based on the data from the years 2002 - 2018 the average number of fires per year is 45. The highest number of reported fire incidents - 63 took place in 2014, and the least - 27 in 2017. The data has a dropping trend.
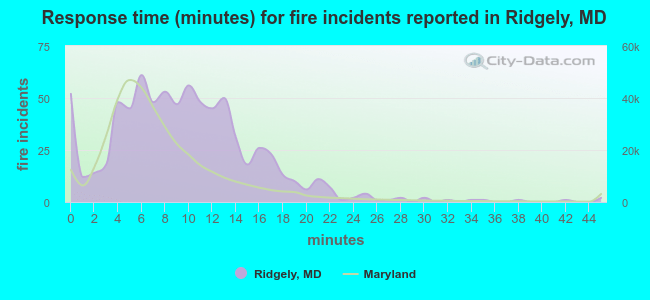 The median response time based on all reported fire incidents is 9 minutes. This is higher compared to the state median value.
The median response time in Ridgely, MD compared to nearest cities:
(Note: Based on data for all years, including only cities with at least 500 fire incidents)
| Ridgely: | 9 minutes |
| Greensboro: | 8 minutes |
| Denton: | 10 minutes |
| Centreville: | 11 minutes |
| Easton: | 8 minutes |
| Preston: | 11 minutes |
| Harrington: | 8 minutes |
| Felton: | 9 minutes |
| Grasonville: | 8 minutes |
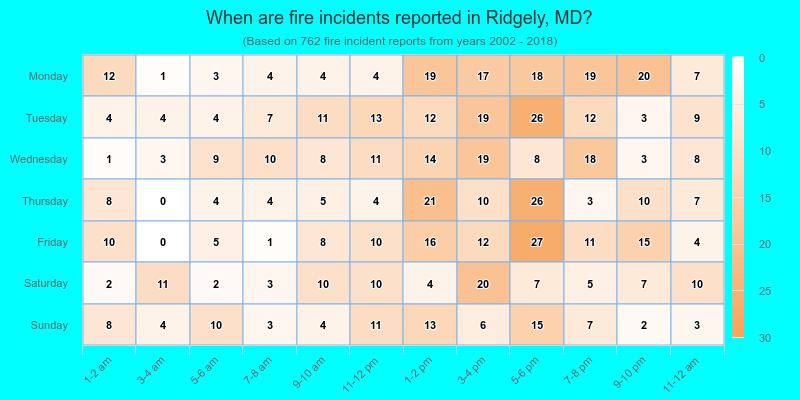
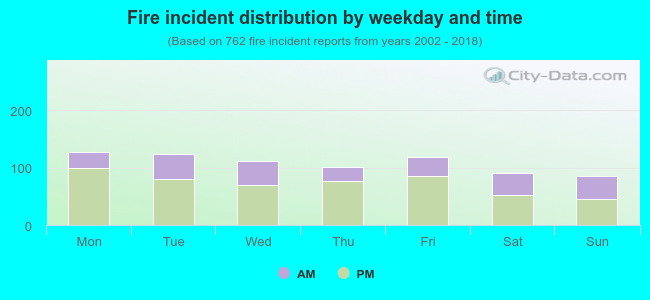 32.8% incidents where reported in the morning and 67.2% in the evening. The most fires (16.8%) took place on Monday, and the least (11.3%) on Sunday.
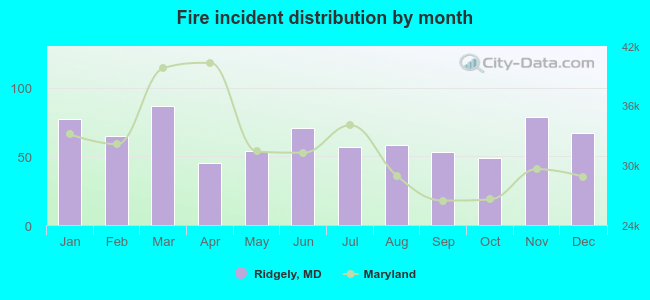 According to the 762 reports from years 2002 - 2018 most fires (11.4%) took place during March, and the least (5.9%) in April.
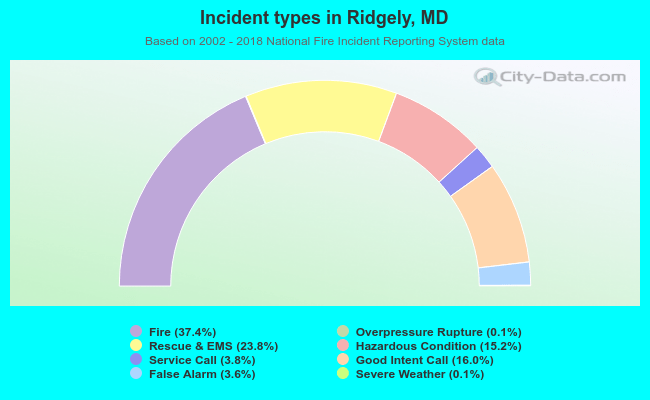 Out of all 2,038 cases reported during the years 2002 - 2018, the most belonged to the categories: Fire (37.4%), Rescue & EMS (23.8%), and Good Intent Call (16.0%).
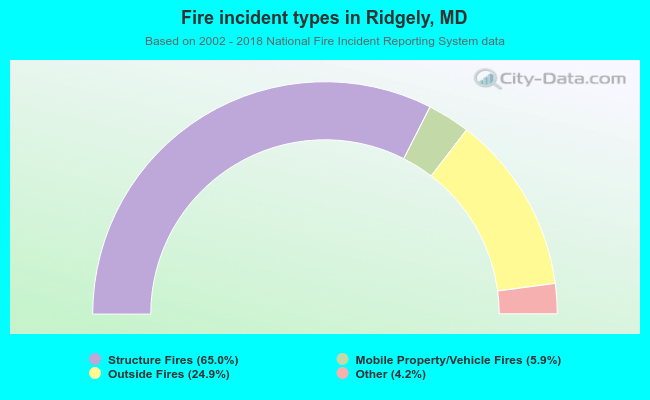 When looking into fire subcategories, the most incidents belonged to: Structure Fires (65.0%), and Outside Fires (24.9%).