| Fire incidents reported |
|---|
| Sreet name | Count |
|---|
| 288-B HWY | 8 | | WISTERIA | 8 | | CR 687 | 6 | | TIMBER CREEK | 6 | | TIMBERCREEK DR | 6 | | 22 HOLLYCHASE | 4 | | 288B | 4 | | BAYOU BEND | 4 | | CR 201A | 4 | | CR 223 | 4 | | EDGEWATER | 4 | | FM 2004 | 4 | | FM 523 | 4 | | HOLLYCHASE | 4 | | QUAIL RUN | 4 | | TIMBERCREEK | 4 | | 10 HOLLYCHASE | 2 | | 100 288B | 2 | | 10310 FM 523 | 2 | | 104 WOBBLER COURT | 2 | | 117 STRATER LN | 2 | | 1170 CR 205 | 2 | | 1231 HWY 288B | 2 | | 1300 HWY 288B | 2 | | 1406 SOUTH VELASCO | 2 |
| | | Fire incidents reported |
|---|
| Sreet name | Count |
|---|
| 1423 CR 201 | 2 | | 1423 CR 687 | 2 | | 1800 N BRAZOSPORT BLVD | 2 | | 1804 N BRAZOSPORT BLVD | 2 | | 200 TIMBERCREEK | 2 | | 2004 2 MILE NORTH OF 523 | 2 | | 2004 @ 288B | 2 | | 2004 @ OYSTER CREEK | 2 | | 2004 @ SHERWOOD FORREST | 2 | | 204 BLUECRAB | 2 | | 213 CR 201 | 2 | | 222 SUCCESS | 2 | | 230 CR 852 | 2 | | 25710 FM 2004 | 2 | | 265 CR 605B | 2 | | 288 @ 3 BRIDGES | 2 | | 288 B | 2 | | 288-B | 2 | | 288B #26 | 2 | | 288B @ 3 BRIDGES | 2 | | 288B @ FIRST BAPTIST CHURCH | 2 | | 288B @ THREE BRIDGES (NORTH) | 2 | | 288B AND CR741 | 2 | | 307 W MAHAN ST | 2 | | |
|
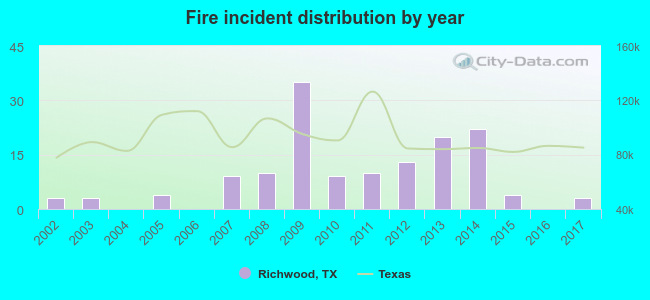 Based on the data from the years 2002 - 2017 the average number of fires per year is 9. The highest number of fire incidents - 35 took place in 2009, and the least - 0 in 2004. The data has a constant trend.
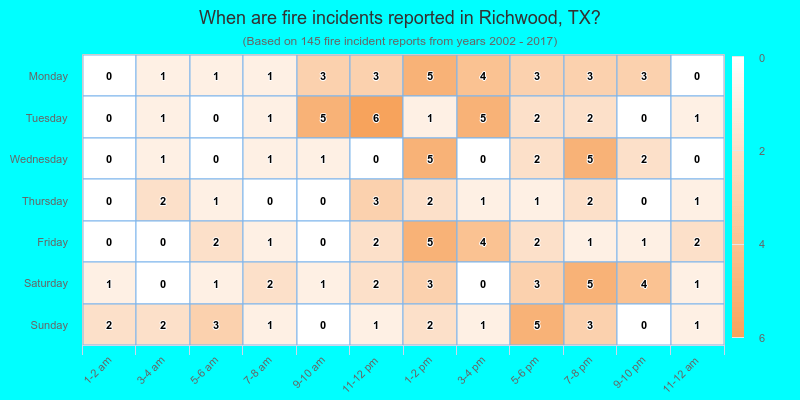
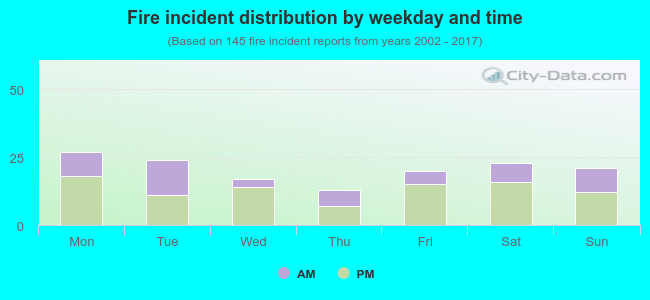 35.9% incidents where reported in the morning and 64.1% in the evening. The most fires (18.6%) took place on Monday, and the least (9.0%) on Thursday.
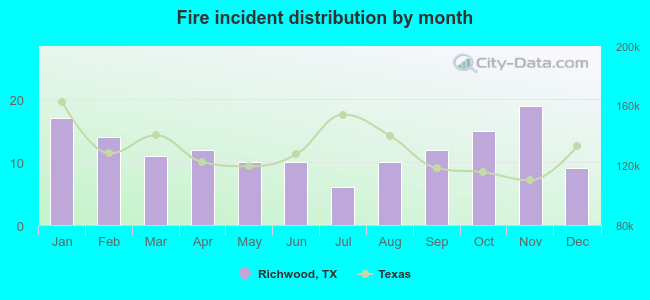 According to the 145 incident reports from years 2002 - 2017 most fires (13.1%) took place during November, and the least (4.1%) in July.
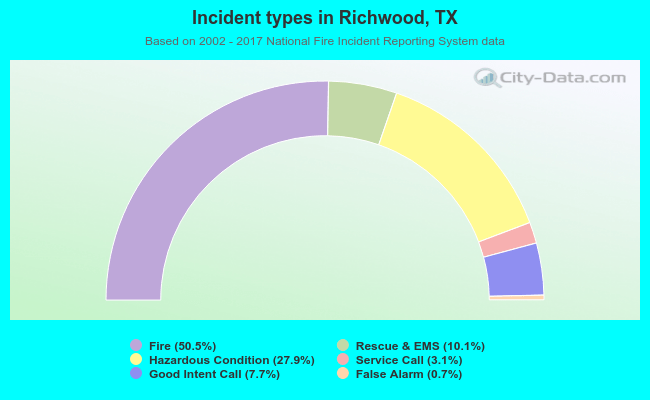 Out of all 287 cases reported during the years 2002 - 2017, the most belonged to the categories: Fire (50.5%), Rescue & EMS (27.9%), and Overpressure Rupture (10.1%).
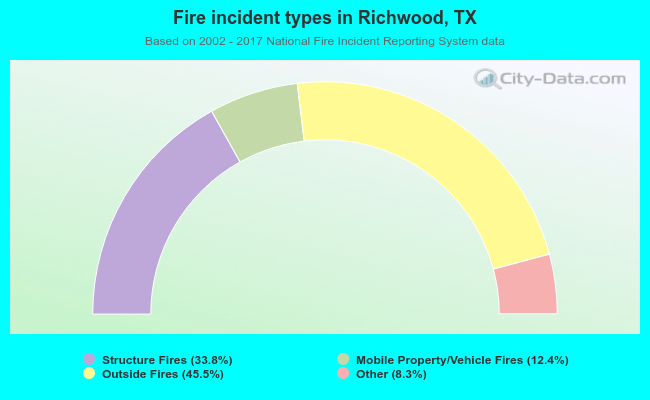 When looking into fire subcategories, the most reports belonged to: Outside Fires (45.5%), and Structure Fires (33.8%).