| Fire incidents reported |
|---|
| Sreet name | Count |
|---|
| 215 SOUTH MAIN STREET | 6 | | 44 MAIN STREET | 6 | | 484 HARDWOOD HILL ROAD | 6 | | 9 DREW ROAD | 6 | | WILLOW STREET | 6 | | 1044 SOUTH RICHFORD ROAD | 4 | | 11 SMITH ROAD | 4 | | 1409 SOUTH RICHFORD ROAD | 4 | | 150 TROY STREET | 4 | | 165 PINNACLE ROAD | 4 | | 195 TROY STREET | 4 | | 21 SWEAT STREET | 4 | | 35 PINNACLE ROAD | 4 | | 444 EAST RICHFORD SLIDE ROAD | 4 | | 484 HARDWOOD HILL RD | 4 | | 548 CORLISS ROAD | 4 | | 558 JAY ROAD | 4 | | 566 PROVINCE STREET | 4 | | 70 LIBERTY STREET | 4 | | 79 EASTERN AVE | 4 | | CORLISS ROAD | 4 | | EAST RICHFORD SLIDE ROAD | 4 | | ELM STREET | 4 | | JAY ROAD | 4 | | MAIN ST. | 4 |
| | | Fire incidents reported |
|---|
| Sreet name | Count |
|---|
| MCALLISTER ROAD | 4 | | 1 HAMILTON PLACE EXT | 2 | | 1 PINNACLE MEADOWS | 2 | | 1 WEBSTER ROAD | 2 | | 1 WEBSTER STREET | 2 | | 10 SEWER PLANT ROAD | 2 | | 10 UNION STREET | 2 | | 101 MAIN STREET | 2 | | 102 HIGHLAND AVE. | 2 | | 11 KINGS COURT | 2 | | 11 WILLOW STREET | 2 | | 112 NOYES STREET | 2 | | 112 THOMAS STREET | 2 | | 115 MAIN ST | 2 | | 115 TROY | 2 | | 115 TROY STREET | 2 | | 119 MAIN STREET | 2 | | 128 JAY ROAD | 2 | | 1306 SOUTH RICHFORD RD | 2 | | 133 HIGHLAND AVE | 2 | | 135 HIGHLAND AVE | 2 | | 136 HIGHLAND AVENUE | 2 | | 137 GUILMETTE ROAD | 2 | | 139 HIGHLAND AVE | 2 | | 140 JAY ROAD | 2 |
|
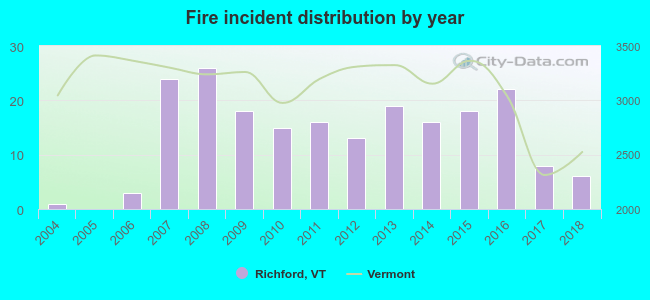 According to the data from the years 2004 - 2018 the average number of fires per year is 14. The highest number of fire incidents - 26 took place in 2008, and the least - 0 in 2005. The data has a rising trend.
 30.7% incidents where reported in the morning and 69.3% in the evening. The most fires (17.1%) took place on Friday, and the least (11.2%) on Wednesday.
 According to the 205 fires from years 2004 - 2018 most fires (12.7%) took place during April, and the least (4.9%) in June.
 Out of all 560 cases reported during the years 2004 - 2018, the most belonged to the categories: Fire (36.6%), Overpressure Rupture (27.9%), and Good Intent Call (17.3%).
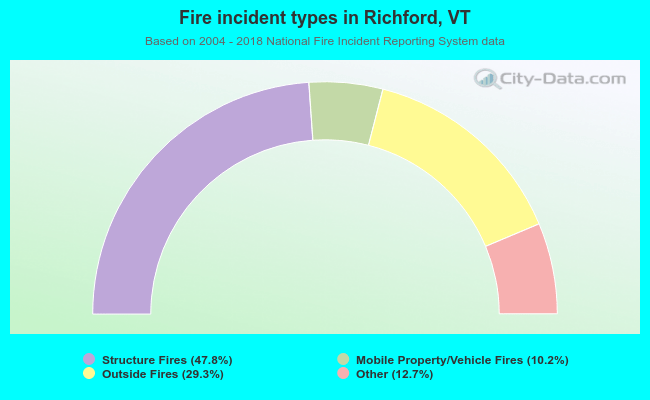 When looking into fire subcategories, the most reports belonged to: Structure Fires (47.8%), and Outside Fires (29.3%).