Rice: Fire Incidents, Texas (TX)
Where are fire incidents reported in Rice, TX
Something went wrong! Please refresh the page.
|
| |||||||||||||||||||||||||||||||||||||||||||||||||||||||||||||||||||||||||||||||||||||||||||||||||||||||||||||
2002 - 2018 National Fire Incident Reporting System (NFIRS) incidents
- Incident types reported to NFIRS in Rice, TX
- 26254.8%Fire
- 9820.5%Rescue & EMS
- 5511.5%Good Intent Call
- 306.3%Service Call
- 265.4%Hazardous Condition
- 51.0%False Alarm
- 10.2%Overpressure Rupture
- 10.2%Severe Weather
- Fire incident types reported to NFIRS in Rice, TX
- 13752.3%Outside Fires
- 8331.7%Structure Fires
- 4015.3%Mobile Property/Vehicle Fires
- 20.8%Other
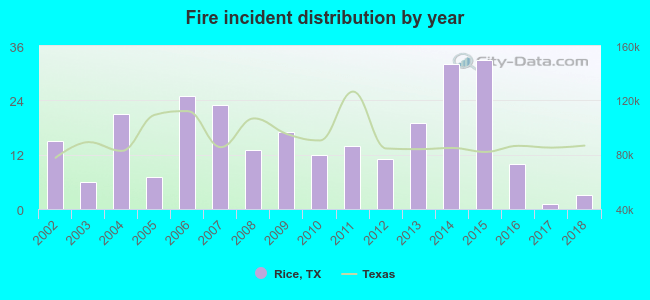 Based on the data from the years 2002 - 2018 the average number of fire incidents per year is 15. The highest number of reported fire incidents - 33 took place in 2015, and the least - 1 in 2017. The data has a declining trend.
 26.7% incidents where reported in the morning and 73.3% in the evening. The most fires (17.2%) took place on Tuesday, and the least (10.7%) on Monday.
 Based on the 262 fire incident reports from years 2002 - 2018 most fires (15.3%) took place during August, and the least (5.0%) in February.
 Out of all 478 cases reported during the years 2002 - 2018, the most belonged to the categories: Fire (54.8%), Rescue & EMS (20.5%), and Good Intent Call (11.5%).
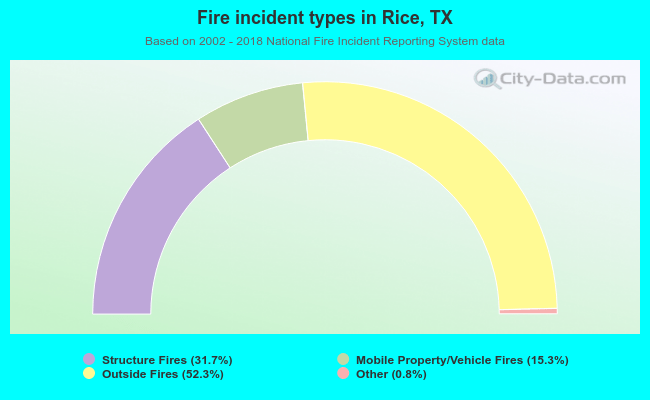 When looking into fire subcategories, the most incidents belonged to: Outside Fires (52.3%), and Structure Fires (31.7%).