Redington Beach: Fire Incidents, Florida (FL)
Where are fire incidents reported in Redington Beach, FL
Something went wrong! Please refresh the page.
|
| |||||||||||||||||||||||||||||||||||||||||||||||||||||||||||||||||||||||||
2005 - 2018 National Fire Incident Reporting System (NFIRS) incidents
- Incident types reported to NFIRS in Redington Beach, FL
- 1,90973.7%Rescue & EMS
- 27810.7%Good Intent Call
- 1566.0%Fire
- 1244.8%Hazardous Condition
- 1034.0%False Alarm
- 130.5%Service Call
- 50.2%Overpressure Rupture
- Fire incident types reported to NFIRS in Redington Beach, FL
- 9762.2%Structure Fires
- 3119.9%Outside Fires
- 1912.2%Other
- 95.8%Mobile Property/Vehicle Fires
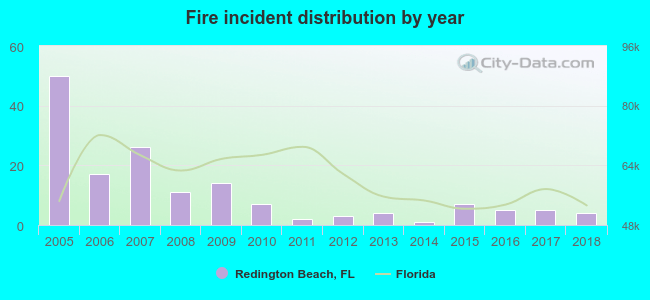 According to the data from the years 2005 - 2018 the average number of fires per year is 11. The highest number of reported fires - 50 took place in 2005, and the least - 1 in 2014. The data has a decreasing trend.
 31.4% incidents where reported in the morning and 68.6% in the evening. The most fires (21.2%) took place on Saturday, and the least (5.1%) on Tuesday.
 According to the 156 incident reports from years 2005 - 2018 most fires (14.1%) took place during June, and the least (1.9%) in August.
 Out of all 2,591 cases reported during the years 2005 - 2018, the most belonged to the categories: Rescue & EMS (73.7%), Good Intent Call (10.7%), and Fire (6.0%).
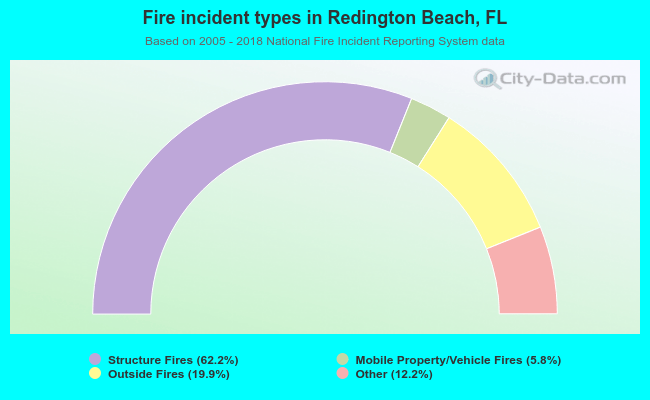 When looking into fire subcategories, the most incidents belonged to: Structure Fires (62.2%), and Outside Fires (19.9%).