Redford: Fire Incidents, Michigan (MI)
Where are fire incidents reported in Redford, MI
Something went wrong! Please refresh the page.
|
| |||||||||||||||||||||||||||||||||||||||||||||||||||||||||||||||||||||||||||||||||||||||||||||||||||||||||||||
2002 - 2013 National Fire Incident Reporting System (NFIRS) incidents
- Incident types reported to NFIRS in Redford, MI
- 62848.0%Hazardous Condition
- 41631.8%Fire
- 1289.8%Service Call
- 997.6%Rescue & EMS
- 332.5%Good Intent Call
- 30.2%False Alarm
- Fire incident types reported to NFIRS in Redford, MI
- 16639.9%Structure Fires
- 10625.5%Mobile Property/Vehicle Fires
- 10024.0%Outside Fires
- 4410.6%Other
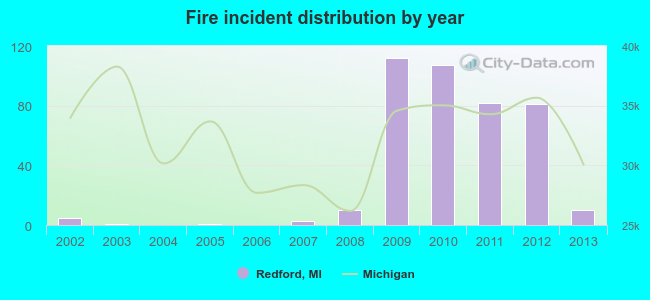 According to the data from the years 2002 - 2013 the average number of fires per year is 34. The highest number of reported fire incidents - 112 took place in 2009, and the least - 0 in 2004. The data has a growing trend.
The average number of yearly fire incidents per 10k residents in Redford, MI compared to nearest cities:
(Note: Based on data for the last 3 years, including only cities with population 5,000 and above)
| Redford: | 0.2 |
| Livonia: | 14.2 |
| Garden City: | 29.7 |
| Dearborn Heights: | 21.7 |
| Farmington: | 18.3 |
| Southfield: | 30.5 |
| Westland: | 25.0 |
| Dearborn: | 28.1 |
| Inkster: | 58.9 |

 Based on the data from the years 2002 - 2013 the average number of fire-related yearly casualties is 1. The highest number of casualties - 8 took place in 2010, and the lowest - 0 in 2002. The data has a constant trend.
 38.2% incidents where reported in the morning and 61.8% in the evening. The most fires (17.3%) took place on Wednesday, and the least (11.1%) on Friday.
 According to the 416 fire incidents from years 2002 - 2013 most fires (10.1%) took place during December, and the least (6.0%) in November.
 Out of all 1,308 cases reported during the years 2002 - 2013, the most belonged to the categories: Rescue & EMS (48.0%), Fire (31.8%), and Hazardous Condition (9.8%).
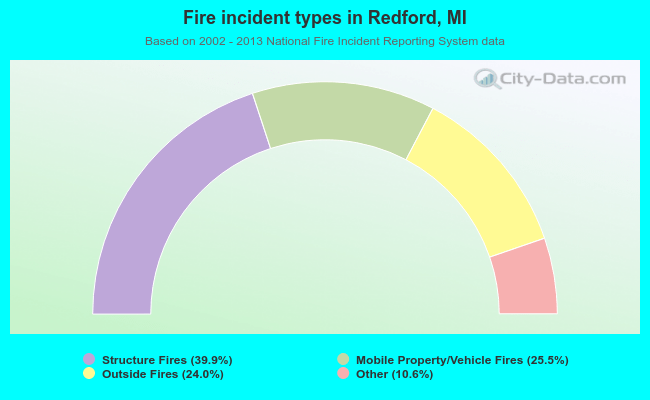 When looking into fire subcategories, the most incidents belonged to: Structure Fires (39.9%), and Mobile Property/Vehicle Fires (25.5%).