Reading: Fire Incidents, Michigan (MI)
Where are fire incidents reported in Reading, MI
Something went wrong! Please refresh the page.
|
| |||||||||||||||||||||||||||||||||||||||||||||||||||||||||||||||||||||||||||||||||||||||||||||||||||||||||||||
2002 - 2018 National Fire Incident Reporting System (NFIRS) incidents
- Incident types reported to NFIRS in Reading, MI
- 24444.3%Hazardous Condition
- 22140.1%Fire
- 5610.2%Rescue & EMS
- 142.5%Good Intent Call
- 81.5%Service Call
- 50.9%False Alarm
- 10.2%Overpressure Rupture
- 10.2%Severe Weather
- 10.2%Special Incident
- Fire incident types reported to NFIRS in Reading, MI
- 9944.8%Outside Fires
- 8940.3%Structure Fires
- 2210.0%Mobile Property/Vehicle Fires
- 115.0%Other
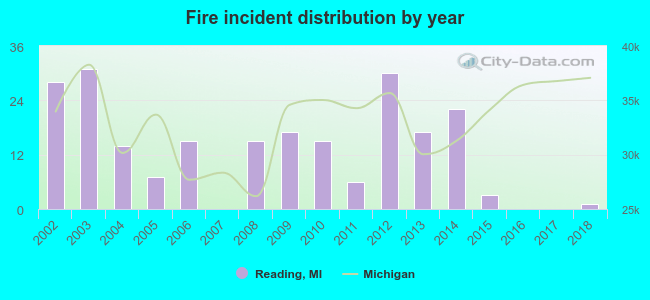 According to the data from the years 2002 - 2018 the average number of fires per year is 13. The highest number of reported fire incidents - 31 took place in 2003, and the least - 0 in 2007. The data has a dropping trend.
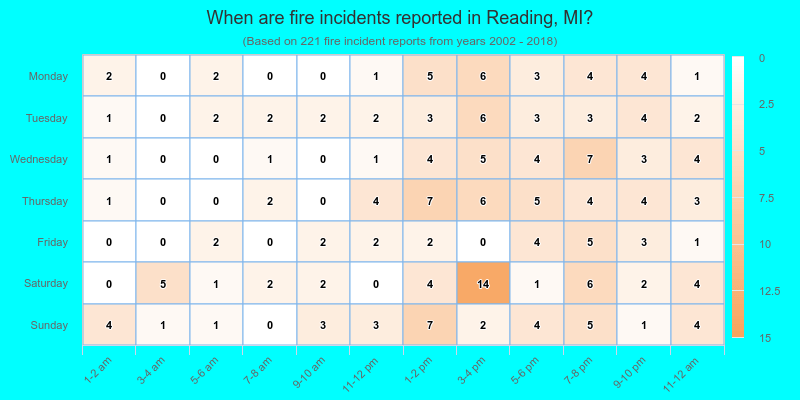
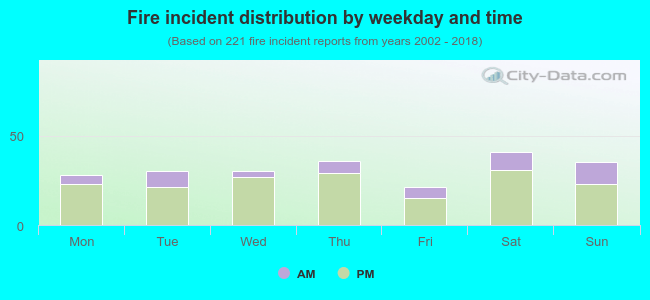 23.5% incidents where reported in the morning and 76.5% in the evening. The most fires (18.6%) took place on Saturday, and the least (9.5%) on Friday.
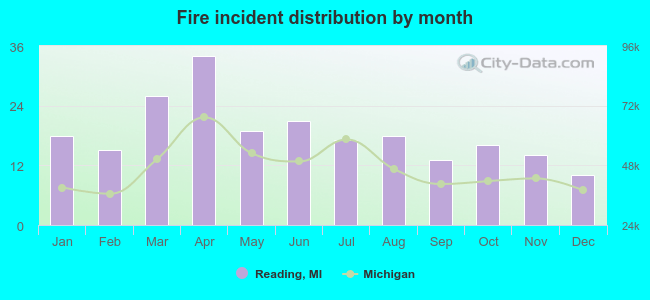 Based on the 221 fire incident reports from years 2002 - 2018 most fires (15.4%) took place during April, and the least (4.5%) in December.
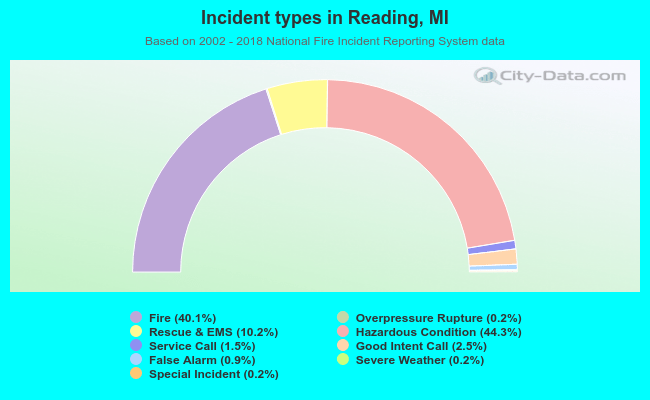 Out of all 551 cases reported during the years 2002 - 2018, the most belonged to the categories: Hazardous Condition (44.3%), Fire (40.1%), and Rescue & EMS (10.2%).
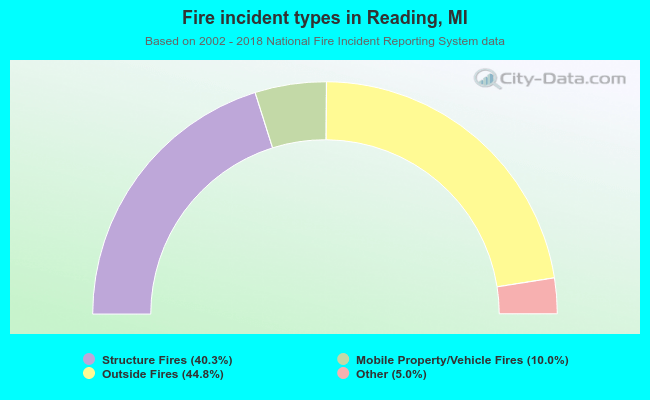 When looking into fire subcategories, the most reports belonged to: Outside Fires (44.8%), and Structure Fires (40.3%).