Rapid City: Fire Incidents, Michigan (MI)
Where are fire incidents reported in Rapid City, MI
Something went wrong! Please refresh the page.
|
| |||||||||||||||||||||||||||||||||||||||||||||||||||||||||||||||||||||||||||||||||||||||||||||||||||||||||||||
2002 - 2018 National Fire Incident Reporting System (NFIRS) incidents
- Incident types reported to NFIRS in Rapid City, MI
- 1,05856.0%Rescue & EMS
- 28315.0%Fire
- 24913.2%Hazardous Condition
- 19010.1%Good Intent Call
- 733.9%Service Call
- 291.5%False Alarm
- 40.2%Severe Weather
- 20.1%Special Incident
- Fire incident types reported to NFIRS in Rapid City, MI
- 15755.5%Structure Fires
- 7526.5%Outside Fires
- 4014.1%Mobile Property/Vehicle Fires
- 113.9%Other
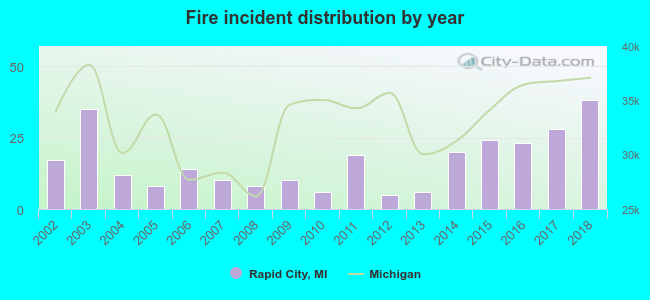 According to the data from the years 2002 - 2018 the average number of fires per year is 17. The highest number of reported fire incidents - 38 took place in 2018, and the least - 5 in 2012. The data has a growing trend.
 32.2% incidents where reported in the morning and 67.8% in the evening. The most fires (19.8%) took place on Saturday, and the least (11.3%) on Tuesday.
 Based on the 283 fire incident reports from years 2002 - 2018 most fires (14.1%) took place during April, and the least (1.8%) in September.
 Out of all 1,888 cases reported during the years 2002 - 2018, the most belonged to the categories: Overpressure Rupture (56.0%), Fire (15.0%), and Rescue & EMS (13.2%).
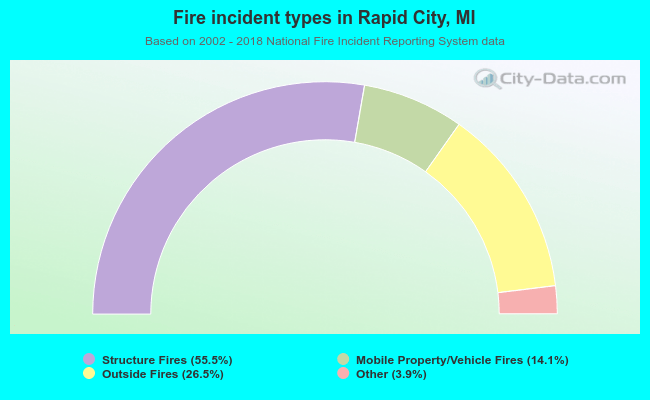 When looking into fire subcategories, the most reports belonged to: Structure Fires (55.5%), and Outside Fires (26.5%).