Random Lake: Fire Incidents, Wisconsin (WI)
Where are fire incidents reported in Random Lake, WI
Something went wrong! Please refresh the page.
|
| |||||||||||||||||||||||||||||||||||||||||||||||||||||||||||||||||||||||||||||||||||||||||||||||||||||||||||||
| Other | 21 | |||||||||||||||||||||||||||||||||||||||||||||||||||||||||||||||||||||||||||||||||||||||||||||||||||||||||||||
2003 - 2018 National Fire Incident Reporting System (NFIRS) incidents
- Incident types reported to NFIRS in Random Lake, WI
- 29157.4%Fire
- 7815.4%Rescue & EMS
- 489.5%Hazardous Condition
- 377.3%Good Intent Call
- 285.5%False Alarm
- 153.0%Service Call
- 51.0%Special Incident
- 30.6%Overpressure Rupture
- 20.4%Severe Weather
- Fire incident types reported to NFIRS in Random Lake, WI
- 13646.7%Structure Fires
- 10435.7%Outside Fires
- 3211.0%Mobile Property/Vehicle Fires
- 196.5%Other
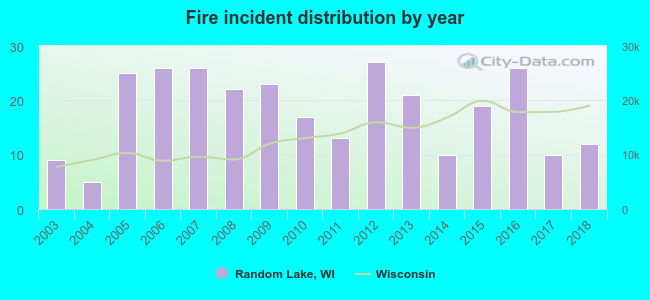 According to the data from the years 2003 - 2018 the average number of fire incidents per year is 18. The highest number of reported fire incidents - 27 took place in 2012, and the least - 5 in 2004. The data has an increasing trend.
 37.8% incidents where reported in the morning and 62.2% in the evening. The most fires (16.8%) took place on Friday, and the least (11.0%) on Sunday.
 According to the 291 fire incident reports from years 2003 - 2018 most fires (17.9%) took place during April, and the least (2.1%) in February.
 Out of all 507 cases reported during the years 2003 - 2018, the most belonged to the categories: Fire (57.4%), Rescue & EMS (15.4%), and Hazardous Condition (9.5%).
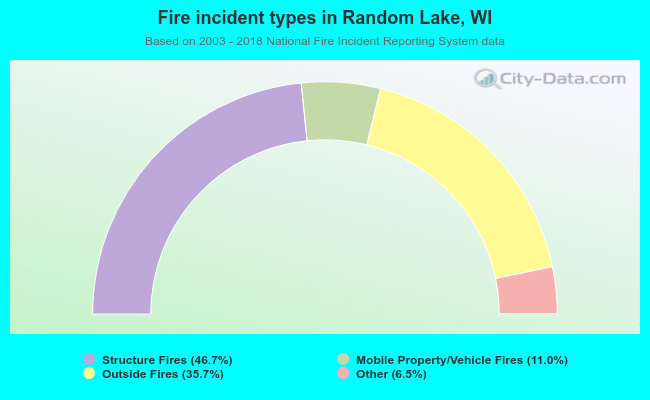 When looking into fire subcategories, the most reports belonged to: Structure Fires (46.7%), and Outside Fires (35.7%).