| Fire incidents reported |
|---|
| Sreet name | Count |
|---|
| CORLISS ROAD | 18 | | RT 60 | 14 | | MAIN STREET | 12 | | CORLISS RD. | 10 | | RT 20 | 10 | | CRAIG RD | 8 | | CRAIG ROAD | 8 | | LOOPS ROAD | 8 | | RT. 60 W SEWELL MT. | 8 | | SNAKE ISLAND ROAD | 8 | | 1872 CORLISS ROAD | 6 | | 41 MAYWOOD RD. | 6 | | 6TH ST | 6 | | 843 SIMMS MOUNTAIN ROAD | 6 | | BROWN SCHOOL RD | 6 | | FLESHMAN HOLLOW RD. | 6 | | ROUTE 60 | 6 | | RT. 20 LILLY PARK | 6 | | SKYLINE DRIVE | 6 | | STONE HOUSE ROAD | 6 | | 105 8TH STREET | 4 | | 1184 CORLISS RD. | 4 | | 1293 SHAWVER ROAD | 4 | | 1321 SOUTH SEWELL STREET | 4 | | 1520 CROSIER RD. (MCROSS) | 4 |
| | | Fire incidents reported |
|---|
| Sreet name | Count |
|---|
| 1588 MAIN STREET | 4 | | 1624 CROSIER ROAD | 4 | | 2008 MAIN STREET MCGROSS | 4 | | 202 MAIN ST | 4 | | 202 MAIN ST. | 4 | | 203 HUNTER ROAD | 4 | | 280 RIVER ROAD | 4 | | 338 VALLEY AVENUE | 4 | | 343 6TH STREET | 4 | | 39 CENTER STREET | 4 | | 43930 MIDLAND TRAIL | 4 | | 504 GREENBRIER AVE | 4 | | 610 MAIN STREET | 4 | | 623 13TH ST. | 4 | | 623 13TH STREET | 4 | | 704 KANAWHA AVE. | 4 | | 726 KANAWHA AVE. | 4 | | 911 SIMMS MOUNTAIN ROAD | 4 | | BELLWOOD | 4 | | CAVENDISH RD | 4 | | CAVENDISH RD. | 4 | | CORLISS RD | 4 | | COUNTY ROUTE # 20 | 4 | | CROSIER ROAD | 4 | | |
|
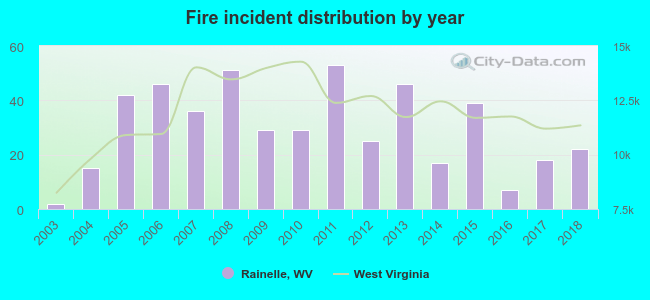 Based on the data from the years 2003 - 2018 the average number of fire incidents per year is 30. The highest number of fire incidents - 53 took place in 2011, and the least - 2 in 2003. The data has a rising trend.
 According to the data from the years 2003 - 2018 the average number of fire-related yearly deaths is 0. The highest number of reported deaths - 1 took place in 2005, and the lowest - 0 in 2003. The data has a constant trend.
 42.1% incidents where reported in the morning and 57.9% in the evening. The most fires (17.2%) took place on Friday, and the least (11.1%) on Saturday.
 According to the 477 fires from years 2003 - 2018 most fires (13.8%) took place during February, and the least (2.9%) in July.
 Out of all 1,191 cases reported during the years 2003 - 2018, the most belonged to the categories: Fire (40.1%), Hazardous Condition (24.7%), and Rescue & EMS (13.1%).
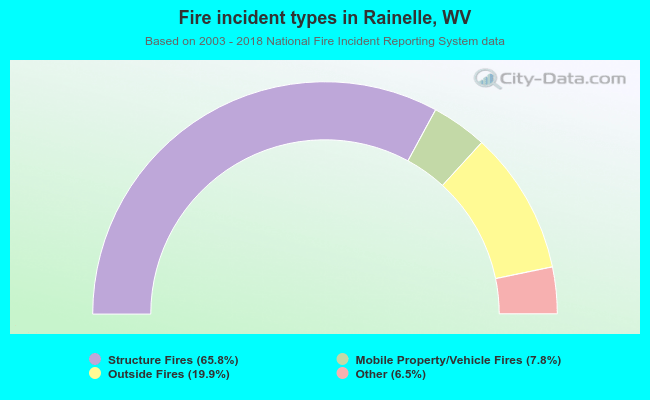 When looking into fire subcategories, the most reports belonged to: Structure Fires (65.8%), and Outside Fires (19.9%).