Quincy: Fire Incidents, Michigan (MI)
Where are fire incidents reported in Quincy, MI
Something went wrong! Please refresh the page.
|
| |||||||||||||||||||||||||||||||||||||||||||||||||||||||||||||||||||||||||||||||||||||||||||||||||||||||||||||
2002 - 2018 National Fire Incident Reporting System (NFIRS) incidents
- Incident types reported to NFIRS in Quincy, MI
- 36036.7%Fire
- 27027.6%Hazardous Condition
- 12012.2%Rescue & EMS
- 788.0%Service Call
- 686.9%Good Intent Call
- 474.8%Special Incident
- 313.2%False Alarm
- 40.4%Severe Weather
- 20.2%Overpressure Rupture
- Fire incident types reported to NFIRS in Quincy, MI
- 17849.4%Structure Fires
- 12334.2%Outside Fires
- 4612.8%Mobile Property/Vehicle Fires
- 133.6%Other
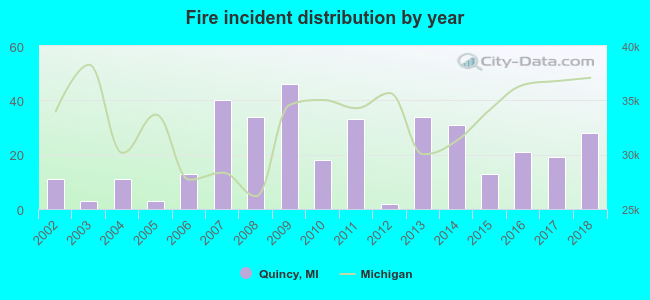 According to the data from the years 2002 - 2018 the average number of fire incidents per year is 21. The highest number of reported fires - 46 took place in 2009, and the least - 2 in 2012. The data has a growing trend.
 28.9% incidents where reported in the morning and 71.1% in the evening. The most fires (17.5%) took place on Sunday, and the least (11.4%) on Thursday.
 Based on the 360 fire incident reports from years 2002 - 2018 most fires (15.6%) took place during April, and the least (2.8%) in December.
 Out of all 980 cases reported during the years 2002 - 2018, the most belonged to the categories: Fire (36.7%), Hazardous Condition (27.6%), and Rescue & EMS (12.2%).
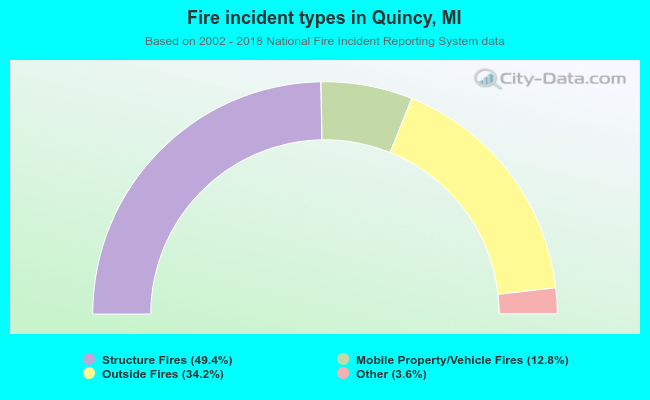 When looking into fire subcategories, the most incidents belonged to: Structure Fires (49.4%), and Outside Fires (34.2%).