Putnam Valley: Fire Incidents, New York (NY)
Where are fire incidents reported in Putnam Valley, NY
Something went wrong! Please refresh the page.
|
| |||||||||||||||||||||||||||||||||||||||||||||||||||||||||||||||||||||||||||||||||||||||||||||||||||||||||||||
2002 - 2018 National Fire Incident Reporting System (NFIRS) incidents
- Incident types reported to NFIRS in Putnam Valley, NY
- 90628.3%Rescue & EMS
- 84526.4%Hazardous Condition
- 62019.4%Fire
- 38712.1%False Alarm
- 2999.3%Good Intent Call
- 1364.3%Service Call
- Fire incident types reported to NFIRS in Putnam Valley, NY
- 30148.5%Structure Fires
- 18930.5%Outside Fires
- 11618.7%Mobile Property/Vehicle Fires
- 142.3%Other
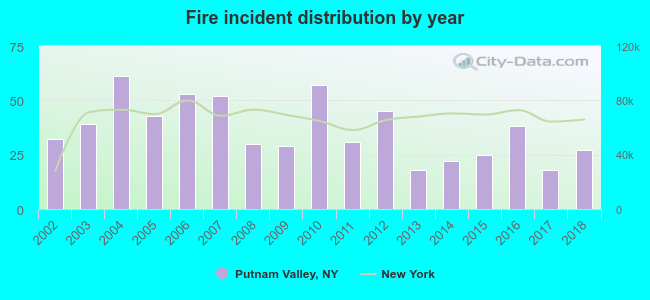 Based on the data from the years 2002 - 2018 the average number of fire incidents per year is 36. The highest number of fire incidents - 61 took place in 2004, and the least - 18 in 2013. The data has a dropping trend.
The average number of yearly fire incidents per 10k residents in Putnam Valley, NY compared to nearest cities:
(Note: Based on data for the last 3 years, including only cities with population 5,000 and above)
| Putnam Valley: | 23.4 |
| Philipstown: | 2.1 |
| Mahopac: | 131.4 |
| Carmel: | 19.4 |
| Yorktown: | 11.7 |
| Peekskill: | 33.7 |
| Somers: | 9.8 |
| Cortlandt: | 11.1 |
| Kent: | 14.3 |
 The median response time based on all reported fire incidents is 8 minutes. This is higher than the New York median value.
The median response time in Putnam Valley, NY compared to nearest cities:
(Note: Based on data for all years, including only cities with at least 500 fire incidents)
| Putnam Valley: | 8 minutes |
| Mahopac: | 7 minutes |
| Carmel: | 8 minutes |
| Yorktown: | 6 minutes |
| Peekskill: | 3 minutes |
| Cortlandt: | 7 minutes |
| Beacon: | 3 minutes |
| Fishkill: | 5 minutes |
| New Windsor: | 7 minutes |
 34.0% incidents where reported in the morning and 66.0% in the evening. The most fires (18.1%) took place on Sunday, and the least (11.5%) on Tuesday.
 Based on the 620 fire incident reports from years 2002 - 2018 most fires (13.5%) took place during April, and the least (4.0%) in September.
 Out of all 3,198 cases reported during the years 2002 - 2018, the most belonged to the categories: Rescue & EMS (28.3%), Hazardous Condition (26.4%), and Fire (19.4%).
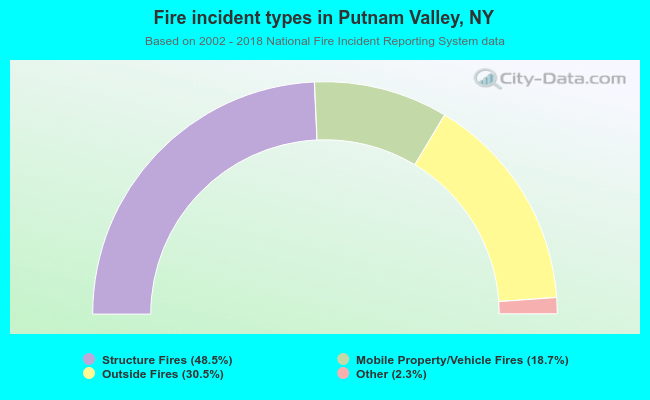 When looking into fire subcategories, the most incidents belonged to: Structure Fires (48.5%), and Outside Fires (30.5%).