Punxsutawney: Fire Incidents, Pennsylvania (PA)
Where are fire incidents reported in Punxsutawney, PA
Something went wrong! Please refresh the page.
|
| |||||||||||||||||||||||||||||||||||||||||||||||||||||||||||||||||||||||||||||||||||||||||||||||||||||||||||||
| Other | 68 | |||||||||||||||||||||||||||||||||||||||||||||||||||||||||||||||||||||||||||||||||||||||||||||||||||||||||||||
2004 - 2018 National Fire Incident Reporting System (NFIRS) incidents
- Incident types reported to NFIRS in Punxsutawney, PA
- 38832.5%Fire
- 28624.0%Hazardous Condition
- 25621.5%Rescue & EMS
- 1058.8%Good Intent Call
- 726.0%False Alarm
- 564.7%Service Call
- 161.3%Severe Weather
- 131.1%Special Incident
- Fire incident types reported to NFIRS in Punxsutawney, PA
- 23059.3%Structure Fires
- 8622.2%Outside Fires
- 379.5%Other
- 359.0%Mobile Property/Vehicle Fires
 Based on the data from the years 2004 - 2018 the average number of fires per year is 26. The highest number of reported fire incidents - 56 took place in 2016, and the least - 5 in 2012. The data has a growing trend.
The average number of yearly fire incidents per 10k residents in Punxsutawney, PA compared to nearest cities:
(Note: Based on data for the last 3 years, including only cities with population 5,000 and above)
| Punxsutawney: | 79.8 |
| DuBois: | 17.0 |
| Indiana: | 30.1 |
| Clearfield: | 60.5 |

 31.7% incidents where reported in the morning and 68.3% in the evening. The most fires (17.0%) took place on Monday, and the least (12.1%) on Wednesday.
 According to the 388 fire incident reports from years 2004 - 2018 most fires (20.9%) took place during April, and the least (3.9%) in November.
 Out of all 1,193 cases reported during the years 2004 - 2018, the most belonged to the categories: Fire (32.5%), Hazardous Condition (24.0%), and Rescue & EMS (21.5%).
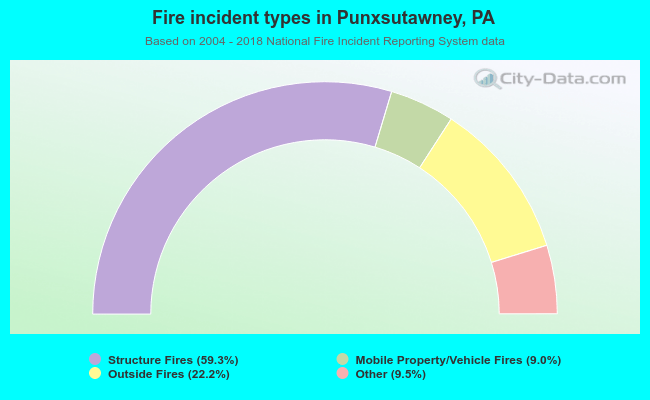 When looking into fire subcategories, the most reports belonged to: Structure Fires (59.3%), and Outside Fires (22.2%).