| Fire incidents reported |
|---|
| Sreet name | Count |
|---|
| ROUTE 78 | 22 | | WASHINGTON ST | 20 | | LYNDON RD. | 14 | | LYNDON ROAD | 12 | | 104 W 2ND ST | 10 | | 2ND | 10 | | 5855 PERKINS ROAD | 10 | | HENRY ROAD | 10 | | 104 W 2ND ST | 8 | | LOMAX ROAD | 8 | | PERKINS RD | 8 | | STAR RD | 8 | | YORKTOWN RD | 8 | | 12400 LOMAX ROAD | 6 | | 3 RD. STREET | 6 | | BISHOP ROAD RD | 6 | | BLUE GOOSE RD | 6 | | BROOKS RD | 6 | | EAST 3RD STREET | 6 | | KINER ROAD | 6 | | LYONS ROAD | 6 | | WASHINGTON ST | 6 | | 14629 LOMAX ROAD | 4 | | 15288 SPRINGHILL ROAD | 4 | | 15441 LOMAX ROAD | 4 |
| | | Fire incidents reported |
|---|
| Sreet name | Count |
|---|
| 17208 STAR ROAD | 4 | | 17770 LOMAX ROAD | 4 | | 18410 HURD ROAD | 4 | | 22150 BROOKS ROAD | 4 | | 2700 AVE | 4 | | 4905 YAGER ROAD | 4 | | 506 EMERY STREET | 4 | | 5286 YORKTOWN ROAD | 4 | | 5482 PERKINS ROAD | 4 | | 6798 YORKTOWN ROAD | 4 | | 701 EAST 3RD STREET | 4 | | 7208 FELTON ROAD | 4 | | ANDERSON RD | 4 | | ANDERSON RD. | 4 | | BISHOP ROAD | 4 | | BLUE GOOSE ROAD | 4 | | COOPER ROAD | 4 | | JERSEY RD | 4 | | MAIN STREET | 4 | | MILL RD. | 4 | | MILL ROAD | 4 | | OSAGE RD | 4 | | THUNDERBOLT RD. | 4 | | WASHINGTON RD. RD | 4 | | |
|
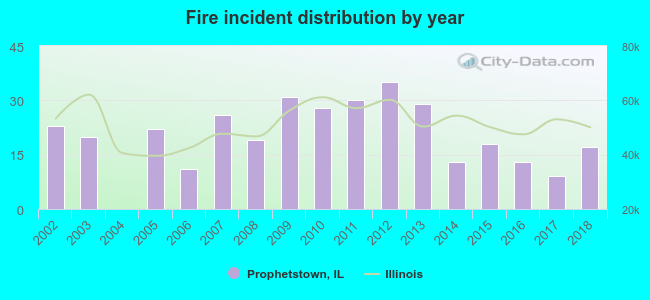 According to the data from the years 2002 - 2018 the average number of fires per year is 20. The highest number of reported fire incidents - 35 took place in 2012, and the least - 0 in 2004. The data has a dropping trend.
 27.0% incidents where reported in the morning and 73.0% in the evening. The most fires (19.8%) took place on Monday, and the least (9.3%) on Thursday.
 According to the 344 incident reports from years 2002 - 2018 most fires (16.3%) took place during March, and the least (5.2%) in February.
 Out of all 677 cases reported during the years 2002 - 2018, the most belonged to the categories: Fire (50.8%), Hazardous Condition (19.5%), and Rescue & EMS (15.2%).
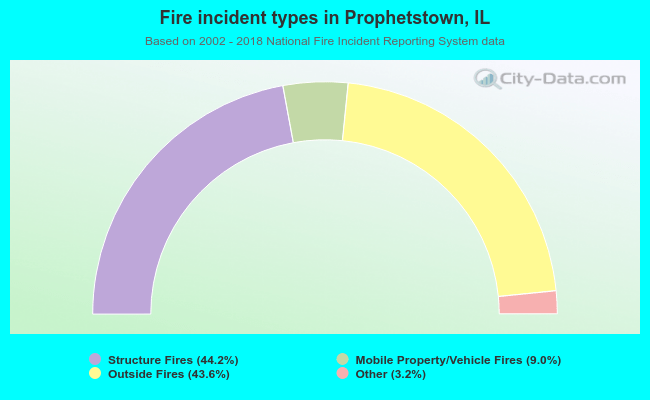 When looking into fire subcategories, the most reports belonged to: Structure Fires (44.2%), and Outside Fires (43.6%).