Prescott: Fire Incidents, Wisconsin (WI)
Where are fire incidents reported in Prescott, WI
Something went wrong! Please refresh the page.
|
| |||||||||||||||||||||||||||||||||||||||||||||||||||||||||||||||||||||||||||||||||||||||||||||||||||||||||||||
| Other | 4 | |||||||||||||||||||||||||||||||||||||||||||||||||||||||||||||||||||||||||||||||||||||||||||||||||||||||||||||
2003 - 2018 National Fire Incident Reporting System (NFIRS) incidents
- Incident types reported to NFIRS in Prescott, WI
- 19832.9%Fire
- 15425.6%Hazardous Condition
- 11819.6%Rescue & EMS
- 6010.0%Good Intent Call
- 589.6%False Alarm
- 122.0%Service Call
- 10.2%Overpressure Rupture
- 10.2%Severe Weather
- Fire incident types reported to NFIRS in Prescott, WI
- 8944.9%Structure Fires
- 6633.3%Outside Fires
- 3216.2%Mobile Property/Vehicle Fires
- 115.6%Other
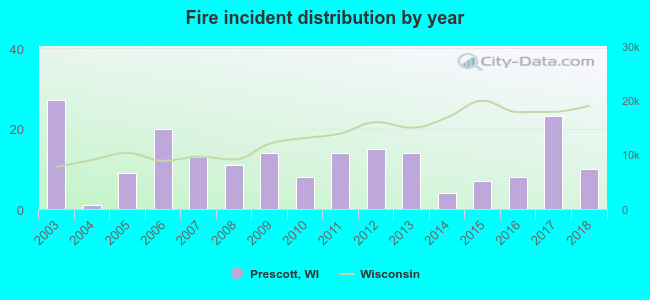 According to the data from the years 2003 - 2018 the average number of fires per year is 12. The highest number of reported fires - 27 took place in 2003, and the least - 1 in 2004. The data has a declining trend.
 35.4% incidents where reported in the morning and 64.6% in the evening. The most fires (19.2%) took place on Monday, and the least (7.6%) on Wednesday.
 Based on the 198 fire incident reports from years 2003 - 2018 most fires (18.7%) took place during April, and the least (3.5%) in December.
 Out of all 602 cases reported during the years 2003 - 2018, the most belonged to the categories: Fire (32.9%), Hazardous Condition (25.6%), and Rescue & EMS (19.6%).
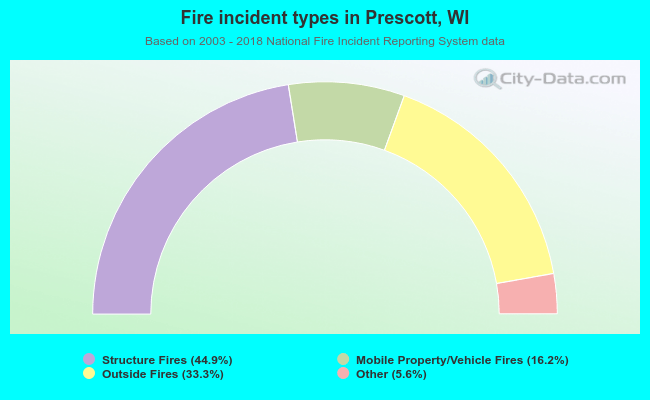 When looking into fire subcategories, the most incidents belonged to: Structure Fires (44.9%), and Outside Fires (33.3%).