Prescott: Fire Incidents, Kansas (KS)
Where are fire incidents reported in Prescott, KS
Something went wrong! Please refresh the page.
|
| |||||||||||||||||||||||||||||||||||||||||||||||||||||||||||||||||||||||||||||||||||||||||||||||||||||
2005 - 2018 National Fire Incident Reporting System (NFIRS) incidents
- Incident types reported to NFIRS in Prescott, KS
- 13655.1%Fire
- 4919.8%Hazardous Condition
- 4217.0%Rescue & EMS
- 83.2%False Alarm
- 72.8%Service Call
- 31.2%Good Intent Call
- 10.4%Severe Weather
- 10.4%Special Incident
- Fire incident types reported to NFIRS in Prescott, KS
- 8764.0%Outside Fires
- 2518.4%Structure Fires
- 2216.2%Mobile Property/Vehicle Fires
- 21.5%Other
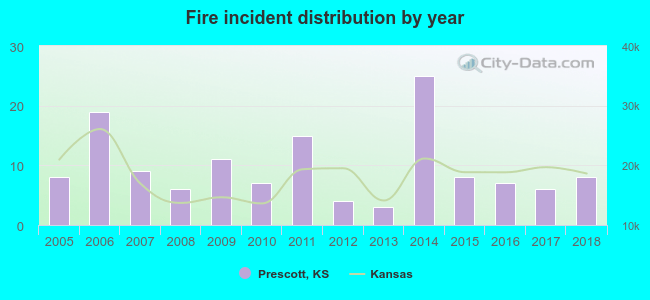 Based on the data from the years 2005 - 2018 the average number of fires per year is 10. The highest number of reported fire incidents - 25 took place in 2014, and the least - 3 in 2013. The data has a constant trend.
 27.9% incidents where reported in the morning and 72.1% in the evening. The most fires (22.8%) took place on Saturday, and the least (8.1%) on Monday.
 According to the 136 fire incident reports from years 2005 - 2018 most fires (31.6%) took place during March, and the least (1.5%) in November.
 Out of all 247 cases reported during the years 2005 - 2018, the most belonged to the categories: Fire (55.1%), Rescue & EMS (19.8%), and Overpressure Rupture (17.0%).
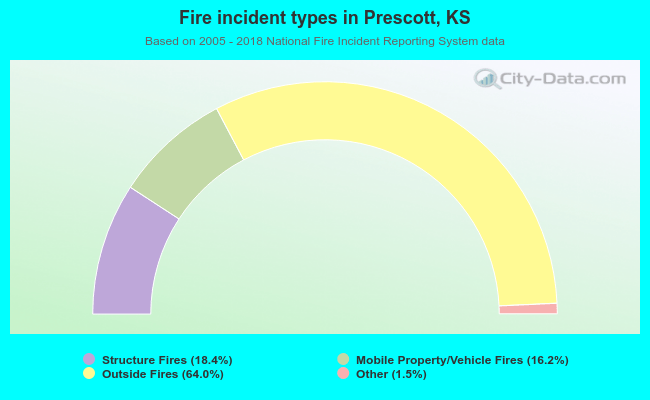 When looking into fire subcategories, the most incidents belonged to: Outside Fires (64.0%), and Structure Fires (18.4%).