| Fire incidents reported |
|---|
| Sreet name | Count |
|---|
| LEWIS RD | 12 | | MAIN ST | 10 | | 30 RT | 8 | | CHURCH ST | 8 | | BENTLEY AVE | 6 | | EAST MAIN ST | 6 | | GRANVILLE ST | 6 | | LEWIS ROAD | 6 | | RTE 30 NORTH | 6 | | 140 RT | 4 | | 169 YORK STREET | 4 | | 2176 HAMPSHIRE HOLLOW RD | 4 | | BRENNAN CIRCLE LGTS | 4 | | CANDLESTICK LANE | 4 | | COLLEGE ST | 4 | | HAMPSHIRE HOLLOW RD | 4 | | MAIN ST | 4 | | RIVER ST | 4 | | RT 30 | 4 | | RT31 | 4 | | RTE 31 | 4 | | ST RT 30 | 4 | | UPPER RD | 4 | | WALKER ROAD | 4 | | YORK ST | 4 |
| | | Fire incidents reported |
|---|
| Sreet name | Count |
|---|
| 1 COLLEGE CIRCLE | 2 | | 1036 RT 31 | 2 | | 1076 ROUTE 30 | 2 | | 120 CHURCH ST | 2 | | 122 COLLEGE ST | 2 | | 127 WALKER RD | 2 | | 130 IDEAL WAY | 2 | | 1303 YORK ST EXT | 2 | | 140 AND FINNEL HOLLOW | 2 | | 148 UPPER ROAD | 2 | | 1551 EAST MAIN ST | 2 | | 162 GROVE STREET | 2 | | 1623 LEWIS ROAD | 2 | | 1660 HIGH ROAD | 2 | | 168 CHURCH STREET | 2 | | 180 ALLEN AVENUE | 2 | | 182 YORK STREET | 2 | | 1844 GRIFFIN RD | 2 | | 19 FERNCLIFF ROAD | 2 | | 191 RIVER ST | 2 | | 200 CHEALSE LANE | 2 | | 200 CHELSEA LANE | 2 | | 2027 HAMPSHIRE HOLLOW RD | 2 | | 2031 ROUTE 31 | 2 | | 2075 GRIFFIN ROAD | 2 |
|
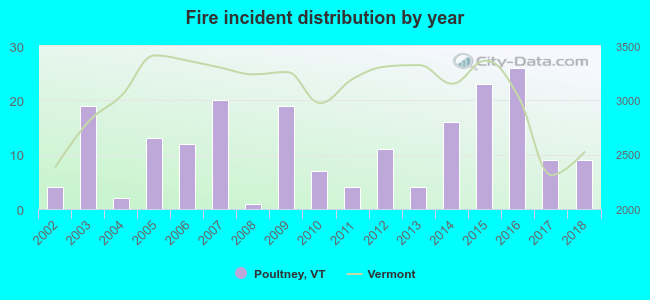 According to the data from the years 2002 - 2018 the average number of fires per year is 12. The highest number of fire incidents - 26 took place in 2016, and the least - 1 in 2008. The data has a rising trend.
 39.2% incidents where reported in the morning and 60.8% in the evening. The most fires (18.6%) took place on Tuesday, and the least (8.5%) on Wednesday.
 According to the 199 fires from years 2002 - 2018 most fires (16.6%) took place during January, and the least (3.0%) in August.
 Out of all 724 cases reported during the years 2002 - 2018, the most belonged to the categories: Fire (27.5%), Hazardous Condition (23.2%), and Rescue & EMS (22.7%).
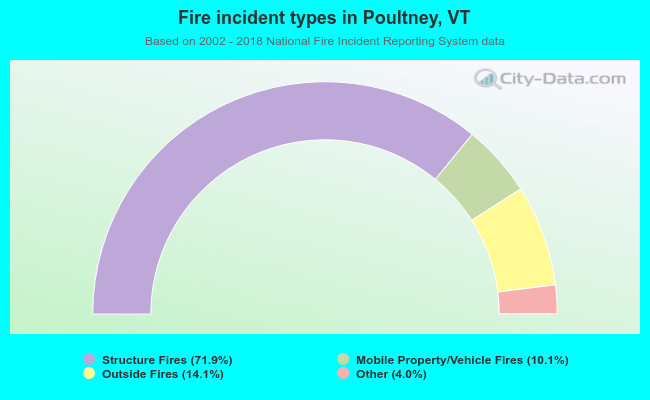 When looking into fire subcategories, the most reports belonged to: Structure Fires (71.9%), and Outside Fires (14.1%).