Potterville: Fire Incidents, Michigan (MI)
Where are fire incidents reported in Potterville, MI
Something went wrong! Please refresh the page.
|
| |||||||||||||||||||||||||||||||||||||||||||||||||||||||||||||||||||||||||||||||||||||||||||||||||||||||||||||
2002 - 2018 National Fire Incident Reporting System (NFIRS) incidents
- Incident types reported to NFIRS in Potterville, MI
- 33330.4%Rescue & EMS
- 31428.6%Fire
- 26223.9%Hazardous Condition
- 827.5%Good Intent Call
- 555.0%Service Call
- 353.2%False Alarm
- 70.6%Severe Weather
- 70.6%Special Incident
- 20.2%Overpressure Rupture
- Fire incident types reported to NFIRS in Potterville, MI
- 12238.9%Outside Fires
- 11235.7%Structure Fires
- 6621.0%Mobile Property/Vehicle Fires
- 144.5%Other
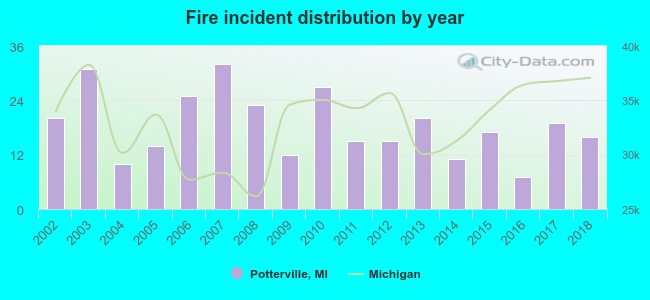 According to the data from the years 2002 - 2018 the average number of fire incidents per year is 18. The highest number of reported fires - 32 took place in 2007, and the least - 7 in 2016. The data has a dropping trend.
 Based on the data from the years 2002 - 2018 the average number of fire-related casualties per year is 0. The highest number of injuries - 3 took place in 2008, and the lowest - 0 in 2003. The data has a declining trend.
 27.7% incidents where reported in the morning and 72.3% in the evening. The most fires (18.5%) took place on Sunday, and the least (9.2%) on Thursday.
 Based on the 314 fires from years 2002 - 2018 most fires (12.7%) took place during June, and the least (3.8%) in December.
 Out of all 1,097 cases reported during the years 2002 - 2018, the most belonged to the categories: Rescue & EMS (30.4%), Fire (28.6%), and Hazardous Condition (23.9%).
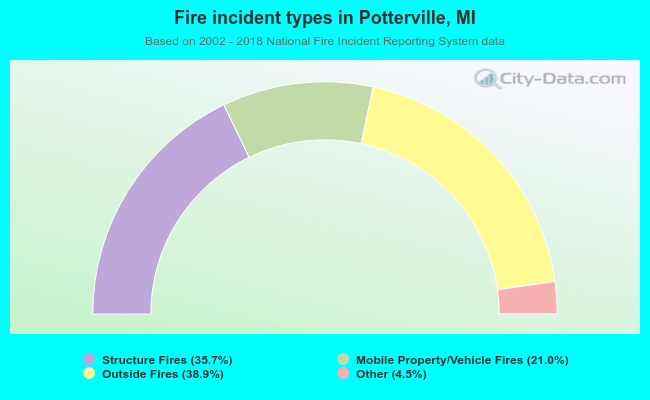 When looking into fire subcategories, the most reports belonged to: Outside Fires (38.9%), and Structure Fires (35.7%).