Post Falls: Fire Incidents, Idaho (ID)
Where are fire incidents reported in Post Falls, ID
Something went wrong! Please refresh the page.
| Fire incidents reported | |
|---|---|
| Sreet name | Count |
| SELTICE WAY | 156 |
| I90 | 136 |
| I-90 | 102 |
| PRAIRIE AVE | 72 |
| HWY 41 | 64 |
| MULLAN AVE | 54 |
| E SELTICE WAY | 50 |
| SELTICE | 48 |
| E 3RD AVE | 44 |
| W SELTICE WAY | 44 |
| E MULLAN AVE | 42 |
| W PRAIRIE AVE | 40 |
| 3RD AVE | 36 |
| HAYDEN AVE | 36 |
| 4TH AVE | 34 |
| N SPOKANE ST | 34 |
| CORBIN RD | 32 |
| GREENSFERRY RD | 28 |
| IDAHO RD | 28 |
| I 90 FWY | 26 |
| INTERSTATE 90 HWY | 26 |
| W RIVERVIEW DR | 26 |
| N BECK RD | 24 |
| RIVERVIEW DR | 24 |
| SPOKANE ST | 24 |
| HIGHWAY 41 | 22 |
| INTERSTATE 90 | 22 |
| E 2ND AVE | 20 |
| MCGUIRE RD | 20 |
| POTLATCH RD | 20 |
| Other | 989 |
2002 - 2018 National Fire Incident Reporting System (NFIRS) incidents
- Incident types reported to NFIRS in Post Falls, ID
- 17,25565.0%Rescue & EMS
- 3,05911.5%Good Intent Call
- 2,3238.7%Fire
- 1,9597.4%Service Call
- 1,1604.4%Hazardous Condition
- 7622.9%False Alarm
- Fire incident types reported to NFIRS in Post Falls, ID
- 95040.9%Structure Fires
- 82835.6%Outside Fires
- 44319.1%Mobile Property/Vehicle Fires
- 1024.4%Other
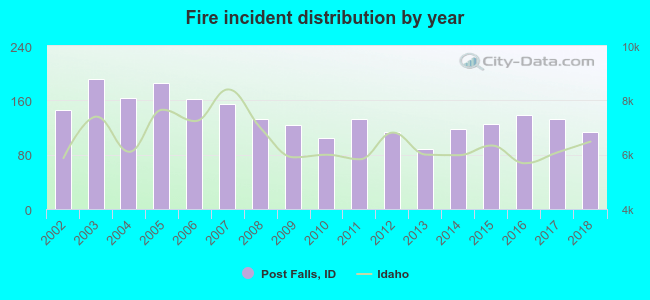 Based on the data from the years 2002 - 2018 the average number of fires per year is 137. The highest number of fire incidents - 191 took place in 2003, and the least - 89 in 2013. The data has a dropping trend.
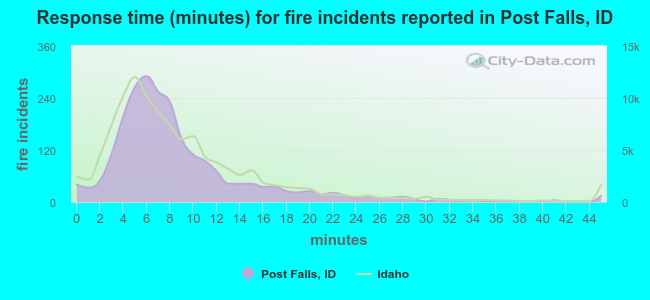 The median response time based on all reported fire incidents is 7 minutes. This is about the same as the Idaho median value.
The median response time in Post Falls, ID compared to nearest cities:
(Note: Based on data for all years, including only cities with at least 500 fire incidents)
| Post Falls: | 7 minutes |
| Rathdrum: | 10 minutes |
| Hayden: | 9 minutes |
| Coeur d'Alene: | 6 minutes |
| Athol: | 12 minutes |
| Priest River: | 9 minutes |
| Sandpoint: | 10 minutes |
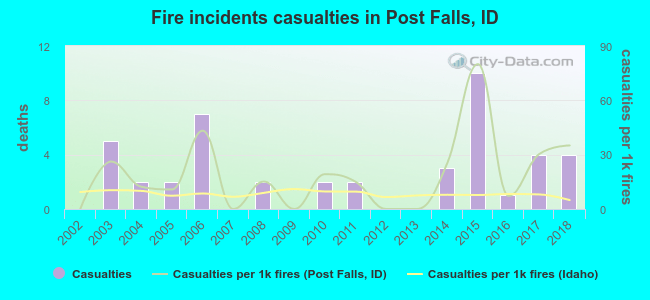 Based on the data from the years 2002 - 2018 the average number of fire-related yearly casualties is 3. The highest number of casualties - 10 took place in 2015, and the lowest - 0 in 2002. The data has a growing trend.
The average number of injuries per 1,000 fire incidents is 19. This indicator was the highest - 80 in 2015, and the lowest 0 in 2002. The trend for injuries per 1,000 fire incidents is increasing. Compared to the state value the number of injuries per 1,000 incidents is much higher.
Based on the data from the years 2002 - 2018 the average number of fire-related yearly casualties is 3. The highest number of casualties - 10 took place in 2015, and the lowest - 0 in 2002. The data has a growing trend.
The average number of injuries per 1,000 fire incidents is 19. This indicator was the highest - 80 in 2015, and the lowest 0 in 2002. The trend for injuries per 1,000 fire incidents is increasing. Compared to the state value the number of injuries per 1,000 incidents is much higher.Casualties per 1,000 incidents in Post Falls, ID compared to nearest cities:
(Note: Based on data for all years, including only cities with at least 500 fire incidents)
| Post Falls: | 18.9 |
| Rathdrum: | 3.4 |
| Hayden: | 3.2 |
| Coeur d'Alene: | 8.6 |
| Athol: | 0.0 |
| Priest River: | 1.6 |
| Sandpoint: | 2.9 |
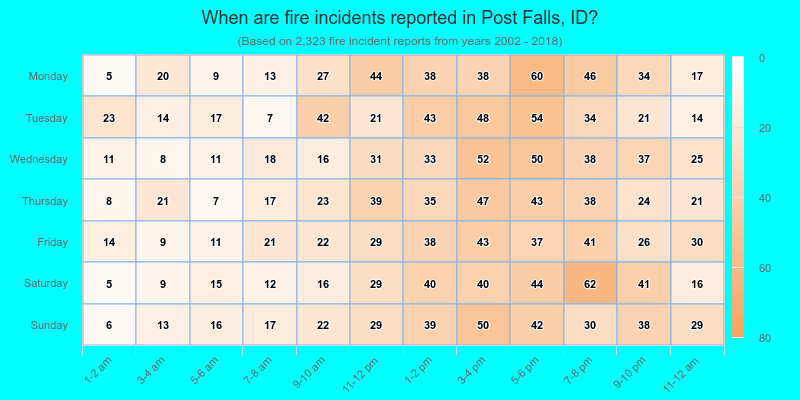
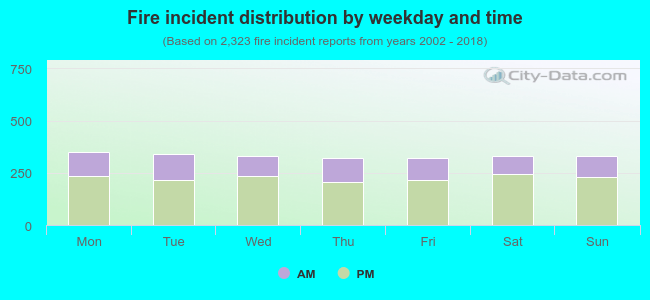 32.2% incidents where reported in the morning and 67.8% in the evening. The most fires (15.1%) took place on Monday, and the least (13.8%) on Friday.
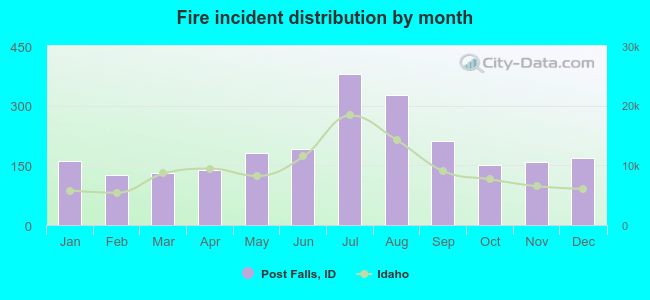 Based on the 2,323 fire incidents from years 2002 - 2018 most fires (16.3%) took place during July, and the least (5.4%) in February.
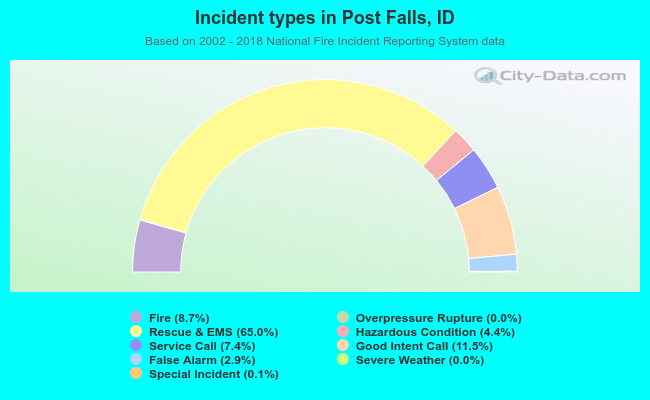 Out of all 26,552 cases reported during the years 2002 - 2018, the most belonged to the categories: Rescue & EMS (65.0%), Good Intent Call (11.5%), and Fire (8.7%).
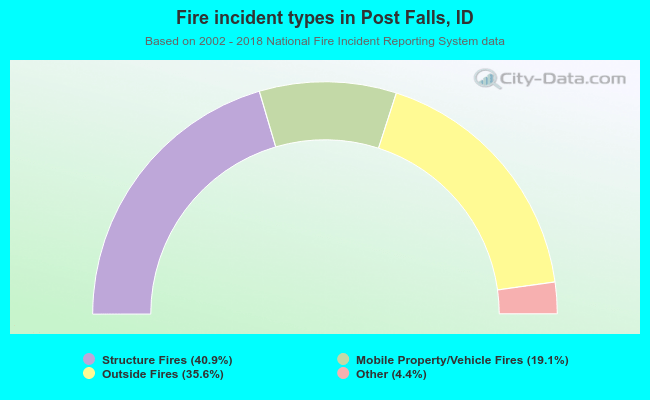 When looking into fire subcategories, the most incidents belonged to: Structure Fires (40.9%), and Outside Fires (35.6%).