Port Richey: Fire Incidents, Florida (FL)
Where are fire incidents reported in Port Richey, FL
Something went wrong! Please refresh the page.
|
| |||||||||||||||||||||||||||||||||||||||||||||||||||||||||||||||||||||||||||||||||||||||||||||||||||||||||||||
2002 - 2018 National Fire Incident Reporting System (NFIRS) incidents
- Incident types reported to NFIRS in Port Richey, FL
- 31,41775.4%Rescue & EMS
- 3,4548.3%Service Call
- 2,7416.6%Good Intent Call
- 1,6524.0%Hazardous Condition
- 1,2543.0%Fire
- 1,0502.5%False Alarm
- 510.1%Special Incident
- Fire incident types reported to NFIRS in Port Richey, FL
- 54743.6%Outside Fires
- 40432.2%Structure Fires
- 26521.1%Mobile Property/Vehicle Fires
- 383.0%Other
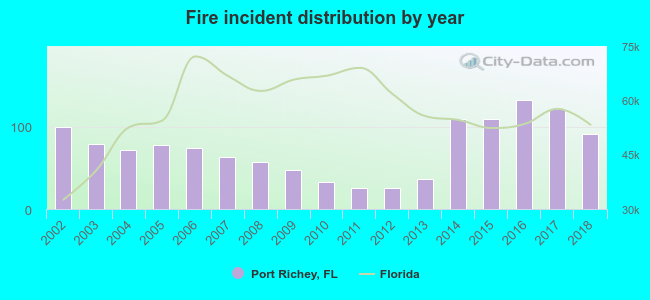 According to the data from the years 2002 - 2018 the average number of fire incidents per year is 74. The highest number of fire incidents - 132 took place in 2016, and the least - 26 in 2011. The data has a dropping trend.
 The median response time based on all reported fire incidents is 5 minutes. This is lower than the Florida median value.
The median response time in Port Richey, FL compared to nearest cities:
(Note: Based on data for all years, including only cities with at least 500 fire incidents)
| Port Richey: | 5 minutes |
| New Port Richey: | 6 minutes |
| Hudson: | 8 minutes |
| Holiday: | 6 minutes |
| Tarpon Springs: | 6 minutes |
| Palm Harbor: | 6 minutes |
| Oldsmar: | 6 minutes |
| Dunedin: | 5 minutes |
| Spring Hill: | 7 minutes |
 According to the data from the years 2002 - 2018 the average number of fire-related casualties per year is 1. The highest number of injuries - 3 took place in 2003, and the lowest - 0 in 2005. The data has a constant trend.
The average number of casualties per 1,000 fire incidents is 15. This indicator was the highest - 61 in 2010, and the lowest 0 in 2005. The trend for casualties per 1,000 incidents is growing. Compared to the state value the number of casualties per 1,000 fires is higher.
According to the data from the years 2002 - 2018 the average number of fire-related casualties per year is 1. The highest number of injuries - 3 took place in 2003, and the lowest - 0 in 2005. The data has a constant trend.
The average number of casualties per 1,000 fire incidents is 15. This indicator was the highest - 61 in 2010, and the lowest 0 in 2005. The trend for casualties per 1,000 incidents is growing. Compared to the state value the number of casualties per 1,000 fires is higher.Casualties per 1,000 incidents in Port Richey, FL compared to nearest cities:
(Note: Based on data for all years, including only cities with at least 500 fire incidents)
| Port Richey: | 17.5 |
| New Port Richey: | 25.6 |
| Hudson: | 25.8 |
| Holiday: | 46.5 |
| Tarpon Springs: | 26.3 |
| Palm Harbor: | 47.8 |
| Oldsmar: | 11.4 |
| Dunedin: | 55.1 |
| Spring Hill: | 21.0 |
 31.3% incidents where reported in the morning and 68.7% in the evening. The most fires (17.0%) took place on Saturday, and the least (12.8%) on Thursday.
 Based on the 1,254 reports from years 2002 - 2018 most fires (11.6%) took place during March, and the least (6.1%) in August.
 Out of all 41,663 cases reported during the years 2002 - 2018, the most belonged to the categories: Rescue & EMS (75.4%), Service Call (8.3%), and Good Intent Call (6.6%).
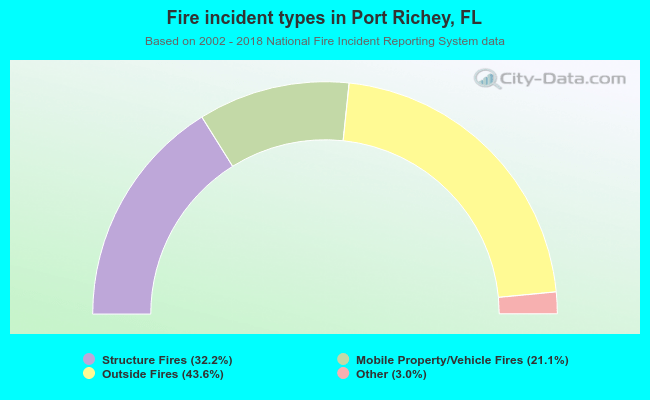 When looking into fire subcategories, the most reports belonged to: Outside Fires (43.6%), and Structure Fires (32.2%).