Port Byron: Fire Incidents, New York (NY)
Where are fire incidents reported in Port Byron, NY
Something went wrong! Please refresh the page.
|
| |||||||||||||||||||||||||||||||||||||||||||||||||||||||||||||||||||||||||||||||||||||||||||||||||||||||||||||
2002 - 2018 National Fire Incident Reporting System (NFIRS) incidents
- Incident types reported to NFIRS in Port Byron, NY
- 1,52766.3%Rescue & EMS
- 2018.7%Hazardous Condition
- 2008.7%Good Intent Call
- 1677.2%Fire
- 1215.3%Service Call
- 672.9%False Alarm
- 130.6%Severe Weather
- 60.3%Special Incident
- Fire incident types reported to NFIRS in Port Byron, NY
- 10562.9%Structure Fires
- 4124.6%Outside Fires
- 116.6%Mobile Property/Vehicle Fires
- 106.0%Other
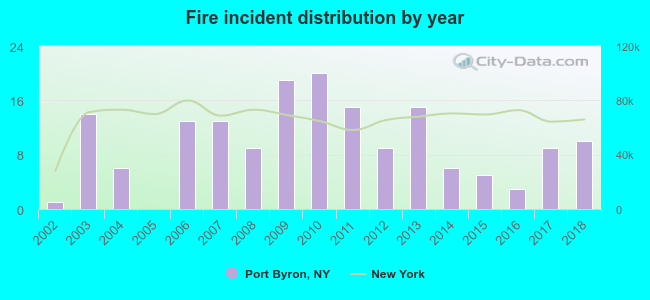 Based on the data from the years 2002 - 2018 the average number of fires per year is 10. The highest number of fire incidents - 20 took place in 2010, and the least - 0 in 2005. The data has a growing trend.
 32.9% incidents where reported in the morning and 67.1% in the evening. The most fires (17.4%) took place on Wednesday, and the least (11.4%) on Friday.
 According to the 167 fire incident reports from years 2002 - 2018 most fires (13.2%) took place during April, and the least (4.2%) in October.
 Out of all 2,304 cases reported during the years 2002 - 2018, the most belonged to the categories: Rescue & EMS (66.3%), Hazardous Condition (8.7%), and Good Intent Call (8.7%).
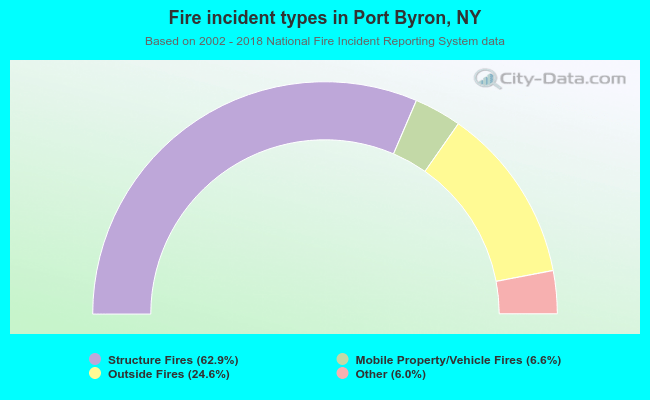 When looking into fire subcategories, the most reports belonged to: Structure Fires (62.9%), and Outside Fires (24.6%).