Poquoson: Fire Incidents, Virginia (VA)
Where are fire incidents reported in Poquoson, VA
Something went wrong! Please refresh the page.
| Fire incidents reported | |
|---|---|
| Sreet name | Count |
| POQUOSON AVE | 166 |
| WYTHE CREEK RD | 144 |
| MESSICK RD | 80 |
| HUNTS NECK RD | 38 |
| ODD RD | 38 |
| LODGE RD | 36 |
| LITTLE FLORIDA RD | 34 |
| RENS RD | 34 |
| RIDGE RD | 34 |
| CHURCH ST | 30 |
| FORREST RD | 28 |
| BENNETT RD | 20 |
| BUNTING LANE | 20 |
| CEDAR RD | 20 |
| HOLLOWAY RD | 20 |
| PASTURE RD | 18 |
| CHARLES PARISH DR | 16 |
| LAYDON WAY | 16 |
| BROWNS NECK RD | 14 |
| EMMAUS RD | 14 |
| FERGUSON ST | 14 |
| HUDGINS RD | 14 |
| POQUOSON AVE AVE | 14 |
| VICTORY BLVD | 14 |
| YORKTOWN RD | 14 |
| ALPHUS ST | 12 |
| BELLS COVE RD | 12 |
| CARRIAGE HILL DR | 10 |
| FREEMAN DR | 10 |
| BEACH RD | 8 |
2003 - 2018 National Fire Incident Reporting System (NFIRS) incidents
- Incident types reported to NFIRS in Poquoson, VA
- 1,44127.6%Rescue & EMS
- 1,29124.7%Service Call
- 1,09421.0%Hazardous Condition
- 68913.2%Fire
- 3807.3%Good Intent Call
- 2033.9%False Alarm
- 751.4%Special Incident
- 310.6%Severe Weather
- 130.2%Overpressure Rupture
- Fire incident types reported to NFIRS in Poquoson, VA
- 31445.6%Outside Fires
- 23634.3%Structure Fires
- 8612.5%Other
- 537.7%Mobile Property/Vehicle Fires
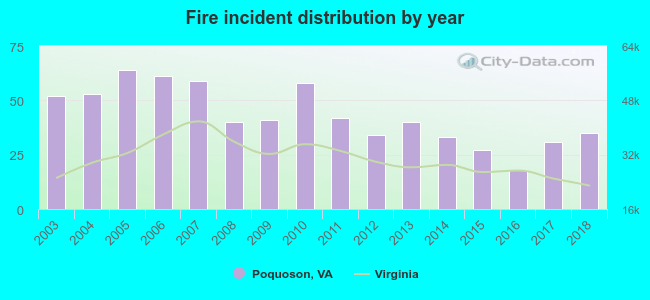 According to the data from the years 2003 - 2018 the average number of fires per year is 43. The highest number of reported fire incidents - 64 took place in 2005, and the least - 18 in 2016. The data has a declining trend.
The average number of yearly fire incidents per 10k residents in Poquoson, VA compared to nearest cities:
(Note: Based on data for the last 3 years, including only cities with population 5,000 and above)
| Poquoson: | 23.2 |
| Hampton: | 28.4 |
| Newport News: | 28.0 |
| Meadowbrook: | 8.5 |
| Smithfield: | 57.1 |
| Norfolk: | 30.1 |
| Brambleton: | 3.6 |
| Williamsburg: | 198.5 |
| Portsmouth: | 39.2 |
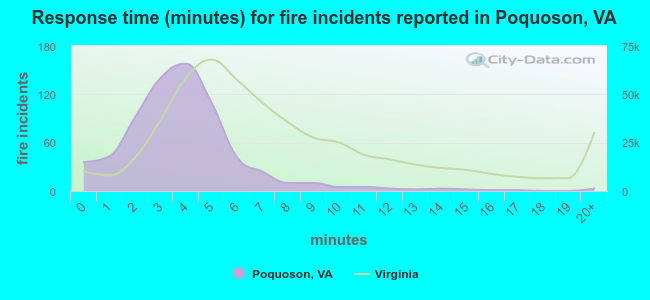 The median response time based on all reported fire incidents is 4 minutes. This is lower compared to the state median value.
The median response time in Poquoson, VA compared to nearest cities:
(Note: Based on data for all years, including only cities with at least 500 fire incidents)
| Poquoson: | 4 minutes |
| Hampton: | 5 minutes |
| Newport News: | 5 minutes |
| Yorktown: | 5 minutes |
| Smithfield: | 7 minutes |
| Norfolk: | 4 minutes |
| Concord: | 10 minutes |
| Williamsburg: | 5 minutes |
| Portsmouth: | 5 minutes |
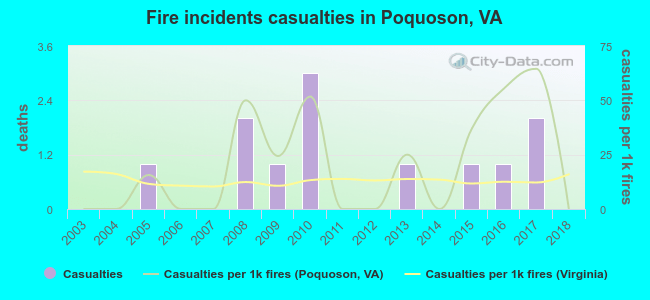 Based on the reports from the years 2003 - 2018 the average number of fire-related yearly casualties is 1. The highest number of casualties - 3 took place in 2010, and the lowest - 0 in 2003. The data has a constant trend.
The average number of injuries per 1,000 fires is 20. This indicator was the highest - 65 in 2017, and the lowest 0 in 2003. The trend for injuries per 1,000 incidents is constant. Compared to the state value the number of injuries per 1,000 fires is higher.
Based on the reports from the years 2003 - 2018 the average number of fire-related yearly casualties is 1. The highest number of casualties - 3 took place in 2010, and the lowest - 0 in 2003. The data has a constant trend.
The average number of injuries per 1,000 fires is 20. This indicator was the highest - 65 in 2017, and the lowest 0 in 2003. The trend for injuries per 1,000 incidents is constant. Compared to the state value the number of injuries per 1,000 fires is higher.Casualties per 1,000 incidents in Poquoson, VA compared to nearest cities:
(Note: Based on data for all years, including only cities with at least 500 fire incidents)
| Poquoson: | 17.4 |
| Hampton: | 19.6 |
| Newport News: | 39.0 |
| Yorktown: | 22.7 |
| Smithfield: | 4.9 |
| Norfolk: | 9.0 |
| Concord: | 0.0 |
| Williamsburg: | 20.8 |
| Portsmouth: | 3.9 |
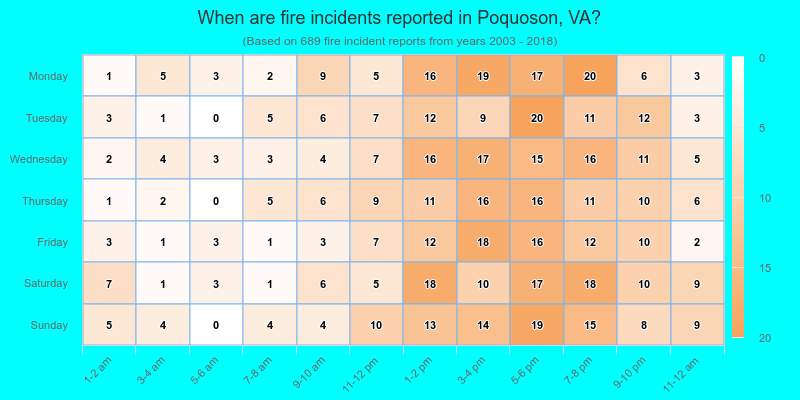
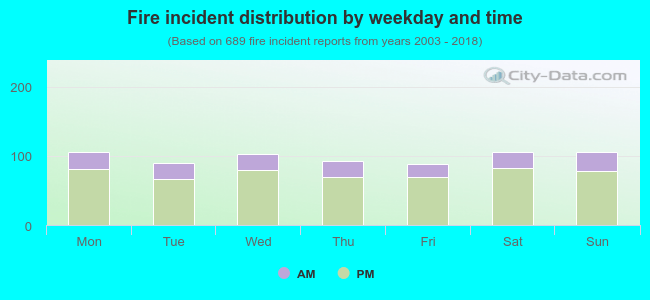 23.4% incidents where reported in the morning and 76.6% in the evening. The most fires (15.4%) took place on Monday, and the least (12.8%) on Friday.
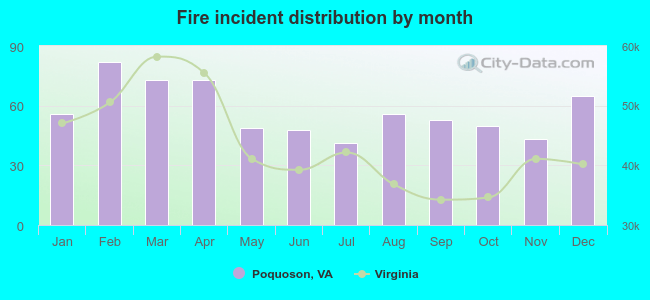 According to the 689 fires from years 2003 - 2018 most fires (11.9%) took place during February, and the least (6.0%) in July.
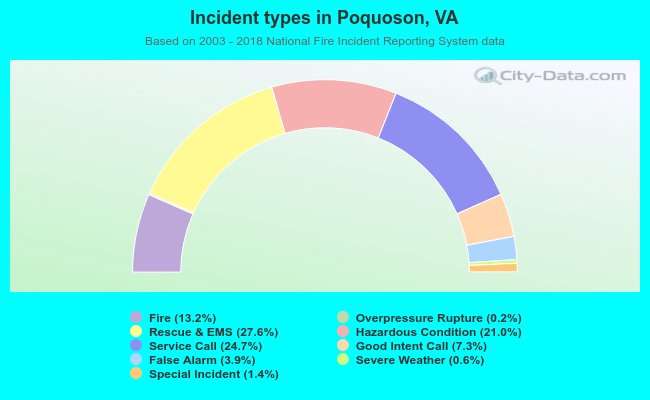 Out of all 5,217 cases reported during the years 2003 - 2018, the most belonged to the categories: Rescue & EMS (27.6%), Service Call (24.7%), and Hazardous Condition (21.0%).
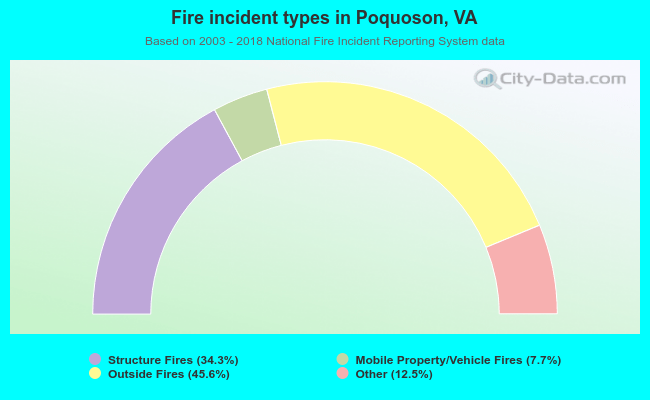 When looking into fire subcategories, the most reports belonged to: Outside Fires (45.6%), and Structure Fires (34.3%).