Poolesville: Fire Incidents, Maryland (MD)
Where are fire incidents reported in Poolesville, MD
Something went wrong! Please refresh the page.
|
| |||||||||||||||||||||||||||||||||||||||||||||||||||||||||||||||||||||||||||||||||||||||||||||||||||||||||||||
2003 - 2018 National Fire Incident Reporting System (NFIRS) incidents
- Incident types reported to NFIRS in Poolesville, MD
- 1,29159.3%Rescue & EMS
- 26412.1%Hazardous Condition
- 24111.1%Good Intent Call
- 21710.0%Fire
- 944.3%Service Call
- 552.5%False Alarm
- 80.4%Special Incident
- 30.1%Overpressure Rupture
- 30.1%Severe Weather
- Fire incident types reported to NFIRS in Poolesville, MD
- 9242.4%Outside Fires
- 7936.4%Structure Fires
- 3918.0%Mobile Property/Vehicle Fires
- 73.2%Other
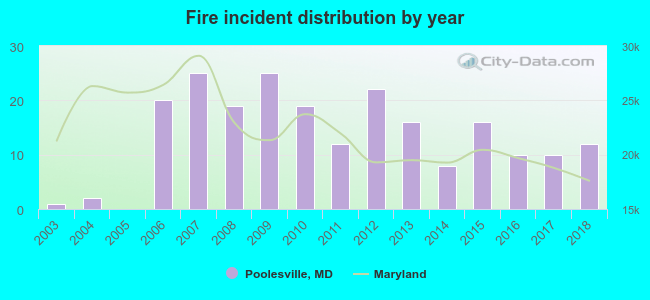 According to the data from the years 2003 - 2018 the average number of fires per year is 14. The highest number of fires - 25 took place in 2007, and the least - 0 in 2005. The data has a rising trend.
The average number of yearly fire incidents per 10k residents in Poolesville, MD compared to nearest cities:
(Note: Based on data for the last 3 years, including only cities with population 5,000 and above)
| Poolesville: | 20.7 |
| Darnestown: | 20.6 |
| Germantown: | 10.3 |
| Clarksburg: | 18.6 |
| Gaithersburg: | 21.4 |
| Montgomery Village: | 8.4 |
| Urbana: | 2.2 |
| Damascus: | 15.7 |
| Potomac: | 9.3 |

 24.9% incidents where reported in the morning and 75.1% in the evening. The most fires (20.3%) took place on Saturday, and the least (8.8%) on Wednesday.
 Based on the 217 fires from years 2003 - 2018 most fires (11.5%) took place during May, and the least (4.6%) in August.
 Out of all 2,176 cases reported during the years 2003 - 2018, the most belonged to the categories: Rescue & EMS (59.3%), Hazardous Condition (12.1%), and Good Intent Call (11.1%).
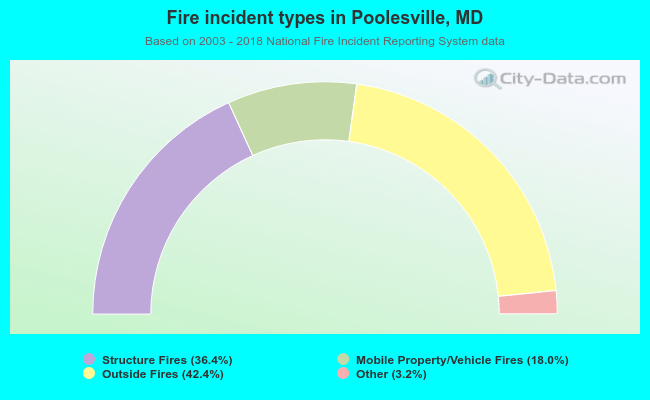 When looking into fire subcategories, the most reports belonged to: Outside Fires (42.4%), and Structure Fires (36.4%).