Ponce de Leon: Fire Incidents, Florida (FL)
Where are fire incidents reported in Ponce de Leon, FL
Something went wrong! Please refresh the page.
|
| |||||||||||||||||||||||||||||||||||||||||||||||||||||||||||||||||||||||||||||||||||||||||||||||||||||||||||||
| Other | 102 | |||||||||||||||||||||||||||||||||||||||||||||||||||||||||||||||||||||||||||||||||||||||||||||||||||||||||||||
2003 - 2018 National Fire Incident Reporting System (NFIRS) incidents
- Incident types reported to NFIRS in Ponce de Leon, FL
- 84347.0%Rescue & EMS
- 47826.6%Fire
- 19811.0%Hazardous Condition
- 1478.2%Good Intent Call
- 864.8%Service Call
- 231.3%False Alarm
- 170.9%Severe Weather
- 30.2%Special Incident
- Fire incident types reported to NFIRS in Ponce de Leon, FL
- 21945.8%Outside Fires
- 17837.2%Structure Fires
- 6814.2%Mobile Property/Vehicle Fires
- 132.7%Other
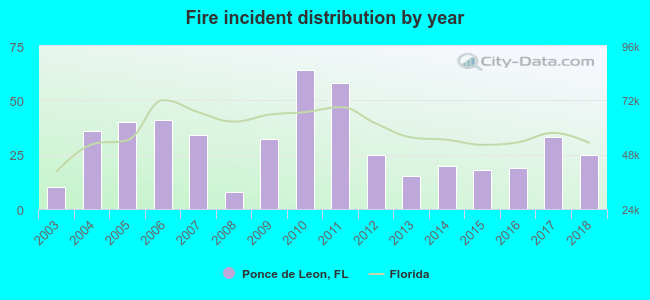 Based on the data from the years 2003 - 2018 the average number of fire incidents per year is 30. The highest number of reported fires - 64 took place in 2010, and the least - 8 in 2008. The data has a rising trend.
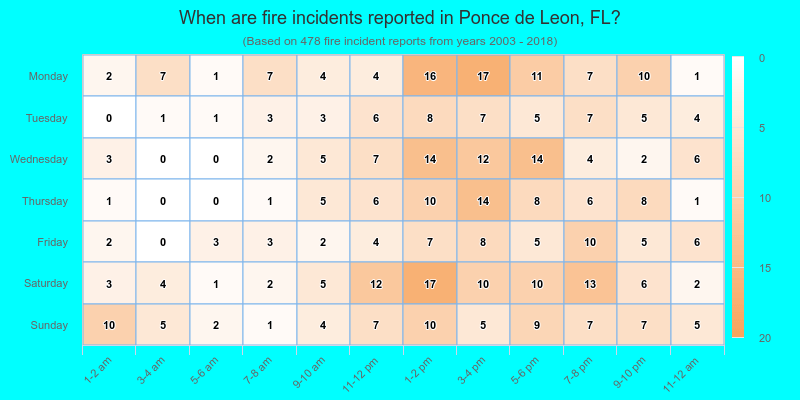
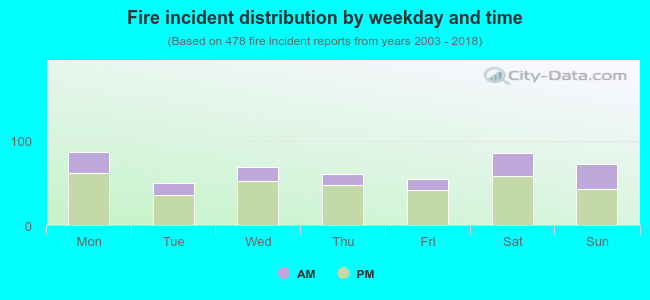 29.1% incidents where reported in the morning and 70.9% in the evening. The most fires (18.2%) took place on Monday, and the least (10.5%) on Tuesday.
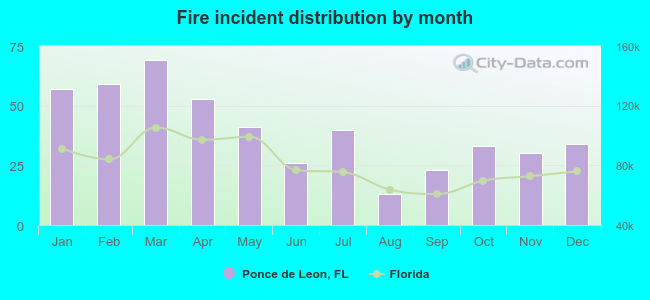 According to the 478 fire incidents from years 2003 - 2018 most fires (14.4%) took place during March, and the least (2.7%) in August.
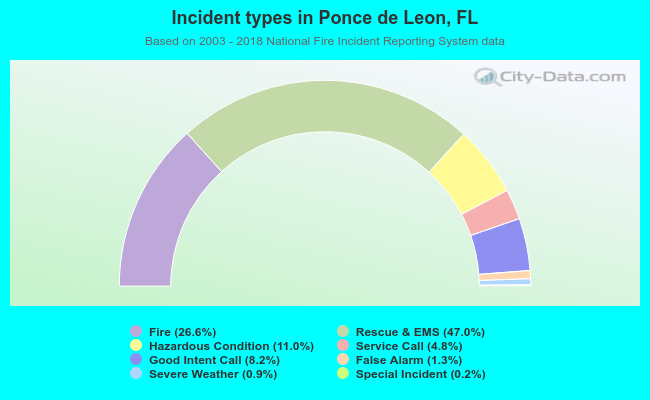 Out of all 1,795 cases reported during the years 2003 - 2018, the most belonged to the categories: Overpressure Rupture (47.0%), Fire (26.6%), and Rescue & EMS (11.0%).
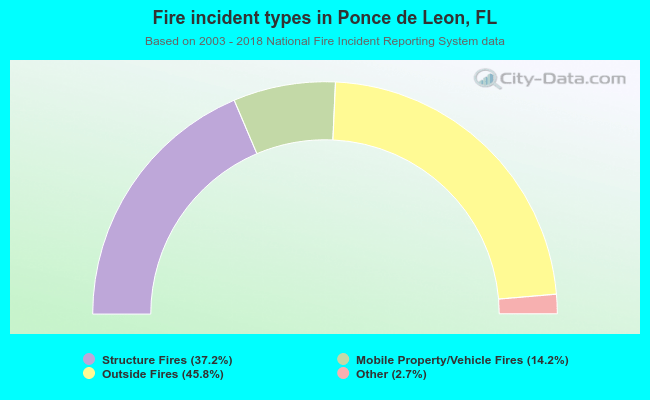 When looking into fire subcategories, the most reports belonged to: Outside Fires (45.8%), and Structure Fires (37.2%).