| Fire incidents reported |
|---|
| Sreet name | Count |
|---|
| RIPLEY ROAD | 22 | | 8733 RIPLEY ROAD | 10 | | 12723 RIPLEY ROAD | 8 | | 28 MAIN STREET | 8 | | 28TH ST / JACKSON AVE | 6 | | 342 APPLE TREE DRIVE | 6 | | 43 LUCAS LANE | 6 | | APPLE TREE DRIVE | 6 | | CHARLESTON ROAD | 6 | | GREER ROAD | 6 | | JACKSON AVE | 6 | | JERICHO RD | 6 | | LIMA RD | 6 | | SANDHILL ROAD | 6 | | 114 NORTON LANE | 4 | | 12305 RIPLEY ROAD | 4 | | 1294 CHARLESTON ROAD | 4 | | 1335 POTTERS CREEK RD | 4 | | 1911 NORTH MAIN STREET | 4 | | 2170 OSHEL ROAD | 4 | | 22 BURDETTE ADDITION | 4 | | 2225 ECKARD CHAPEL RD | 4 | | 2300 MARIETTA STREET | 4 | | 2413 SANDHILL ROAD | 4 | | 300 BLOCK OF MAIN ST | 4 |
| | | Fire incidents reported |
|---|
| Sreet name | Count |
|---|
| 310 5TH STREET | 4 | | 3200 JERICHO ROAD | 4 | | 324 MAIN STREET | 4 | | 3713 SANDHILL ROAD | 4 | | 3RD STREET | 4 | | 4152 OSHEL ROAD | 4 | | 8597 OHIO RIVER ROAD | 4 | | 865 ROSITA LYNN DRIVE | 4 | | 92 EDWARD LANE | 4 | | CAMP CONLEY ROAD | 4 | | HIGHLAND AVE | 4 | | JERICHO ROAD | 4 | | KANAWHA STREET | 4 | | LINCOLN AVE | 4 | | LOCK 25 ROAD | 4 | | MAIN STREET | 4 | | MEADOWBROOK DRIVE | 4 | | MONROE AVE | 4 | | OHIO RIVER ROAD | 4 | | RAYBURN RD | 4 | | RAYBURN RD. | 4 | | RAYBURN ROAD | 4 | | VIAND STREET | 4 | | WATER ST | 4 | | 10000 KANAWHA VALLEY ROAD | 2 |
|
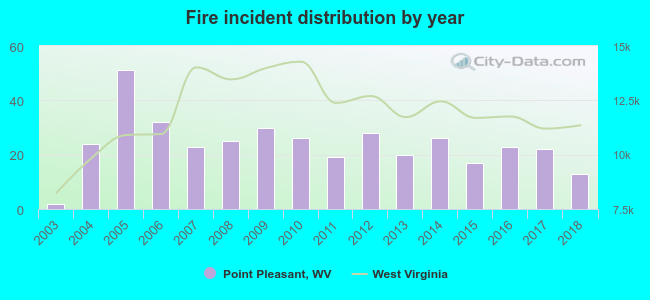 Based on the data from the years 2003 - 2018 the average number of fire incidents per year is 24. The highest number of fires - 51 took place in 2005, and the least - 2 in 2003. The data has an increasing trend.
 Based on the data from the years 2003 - 2018 the average number of fire-related fatalities per year is 0. The highest number of reported deaths - 2 took place in 2014, and the lowest - 0 in 2003. The data has a constant trend.
 33.9% incidents where reported in the morning and 66.1% in the evening. The most fires (18.9%) took place on Tuesday, and the least (11.0%) on Saturday.
 According to the 381 fire incidents from years 2003 - 2018 most fires (11.3%) took place during March, and the least (4.2%) in October.
 Out of all 1,181 cases reported during the years 2003 - 2018, the most belonged to the categories: Fire (32.3%), Hazardous Condition (29.3%), and Rescue & EMS (16.3%).
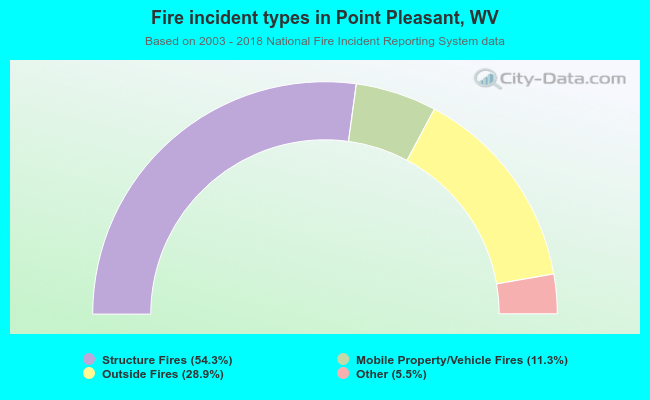 When looking into fire subcategories, the most incidents belonged to: Structure Fires (54.3%), and Outside Fires (28.9%).