Point Pleasant Beach: Fire Incidents, New Jersey (NJ)
Where are fire incidents reported in Point Pleasant Beach, NJ
Something went wrong! Please refresh the page.
|
| |||||||||||||||||||||||||||||||||||||||||||||||||||||||||||||||||||||||||||||||||||||||||||||||||||||||||||||
2004 - 2015 National Fire Incident Reporting System (NFIRS) incidents
- Incident types reported to NFIRS in Point Pleasant Beach, NJ
- 39865.0%Hazardous Condition
- 19231.4%Fire
- 122.0%Service Call
- 61.0%Good Intent Call
- 30.5%Rescue & EMS
- 10.2%False Alarm
- Fire incident types reported to NFIRS in Point Pleasant Beach, NJ
- 13570.3%Structure Fires
- 3518.2%Outside Fires
- 168.3%Mobile Property/Vehicle Fires
- 63.1%Other
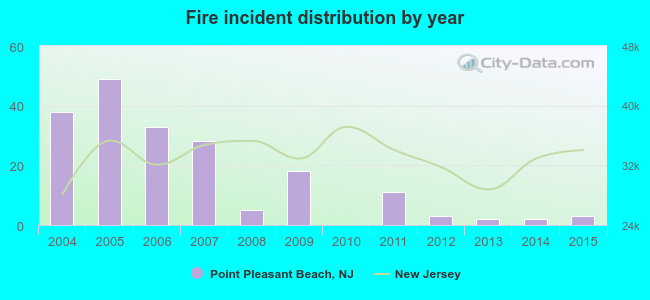 According to the data from the years 2004 - 2015 the average number of fires per year is 16. The highest number of fires - 49 took place in 2005, and the least - 0 in 2010. The data has a decreasing trend.
 28.1% incidents where reported in the morning and 71.9% in the evening. The most fires (16.7%) took place on Friday, and the least (13.0%) on Thursday.
 According to the 192 fire incidents from years 2004 - 2015 most fires (11.5%) took place during May, and the least (3.1%) in November.
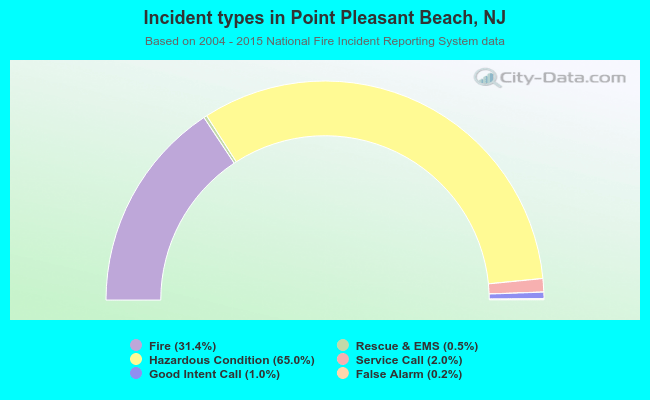 Out of all 612 cases reported during the years 2004 - 2015, the most belonged to the categories: Rescue & EMS (65.0%), Fire (31.4%), and Hazardous Condition (2.0%).
 When looking into fire subcategories, the most reports belonged to: Structure Fires (70.3%), and Outside Fires (18.2%).