Plymouth: Fire Incidents, New York (NY)
Where are fire incidents reported in Plymouth, NY
Something went wrong! Please refresh the page.
|
| |||||||||||||||||||||||||||||||||||||||||||||||||||||||||||||||||||||||||||||||||
2003 - 2018 National Fire Incident Reporting System (NFIRS) incidents
- Incident types reported to NFIRS in Plymouth, NY
- 32560.7%Rescue & EMS
- 10219.1%Fire
- 397.3%Hazardous Condition
- 387.1%Good Intent Call
- 213.9%Service Call
- 50.9%False Alarm
- 50.9%Severe Weather
- Fire incident types reported to NFIRS in Plymouth, NY
- 7472.5%Structure Fires
- 1413.7%Outside Fires
- 87.8%Mobile Property/Vehicle Fires
- 65.9%Other
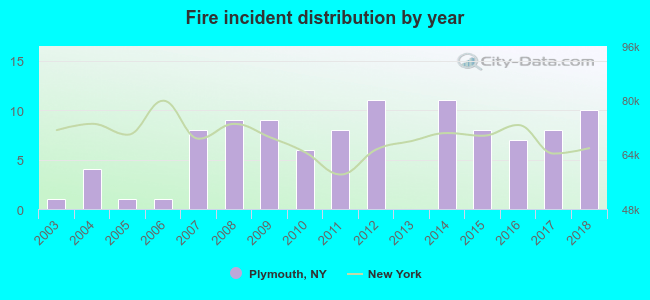 Based on the data from the years 2003 - 2018 the average number of fire incidents per year is 6. The highest number of fire incidents - 11 took place in 2012, and the least - 0 in 2013. The data has an increasing trend.
 46.1% incidents where reported in the morning and 53.9% in the evening. The most fires (22.5%) took place on Monday, and the least (5.9%) on Tuesday.
 According to the 102 fires from years 2003 - 2018 most fires (15.7%) took place during January, and the least (2.0%) in June.
 Out of all 535 cases reported during the years 2003 - 2018, the most belonged to the categories: Overpressure Rupture (60.7%), Fire (19.1%), and Rescue & EMS (7.3%).
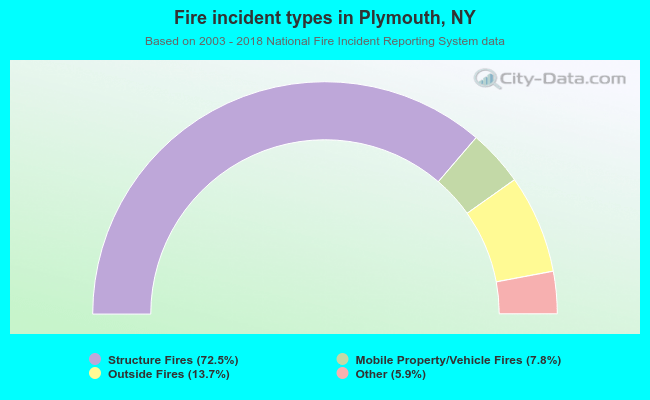 When looking into fire subcategories, the most reports belonged to: Structure Fires (72.5%), and Outside Fires (13.7%).