| Fire incidents reported |
|---|
| Sreet name | Count |
|---|
| EASTON RD | 66 | | STUMP RD | 50 | | OLD EASTON RD | 24 | | SWAMP RD | 12 | | SILO HILL RD | 10 | | APPLEBUTTER RD | 8 | | BURNT HOUSE HILL RD | 8 | | CURLY HILL RD | 8 | | WORTHINGTON RD | 8 | | 5000 STUMP ROAD STA. 24 | 6 | | AIRPORT BLVD | 6 | | CABIN RUN RD | 6 | | CURLEY HILL RD | 6 | | DURHAM RD | 6 | | FERRY RD | 6 | | HARING RD | 6 | | MAIN ST | 6 | | POINT PLEASANT PK | 6 | | VALLEY PARK RD | 6 | | WINDTREE DR | 6 | | WINTERBERRY DR | 6 | | AIRPORT BL | 4 | | ALDER DR | 4 | | DILLON RD | 4 | | EMILY DR | 4 |
| | | Fire incidents reported |
|---|
| Sreet name | Count |
|---|
| GEDDES WY | 4 | | JOHN DYER WY | 4 | | KELLERS CHURCH RD | 4 | | POINT PLEASANT | 4 | | ROSEBERRY DR | 4 | | ROUTE 313 RT | 4 | | SPLIT LOG DR | 4 | | 5000 STUMP ROAD STA 24 | 2 | | AIRPORT RD RD | 2 | | AZLEN | 2 | | BARN OWL RD | 2 | | BEDMINSTER RD | 2 | | BELMONT MANOR DR | 2 | | BROAD ST | 2 | | BUCKS RD | 2 | | CEPHAS CHILD RD | 2 | | CHRISTOPHER DAY RD | 2 | | CRAIGS VIEW | 2 | | CREEK RD | 2 | | CROSS KEYS DR | 2 | | DOWNS RU | 2 | | ESSEX DR | 2 | | FACHETS | 2 | | FARM SCHOOL RD | 2 | | GALLOWS HILL RD | 2 |
|
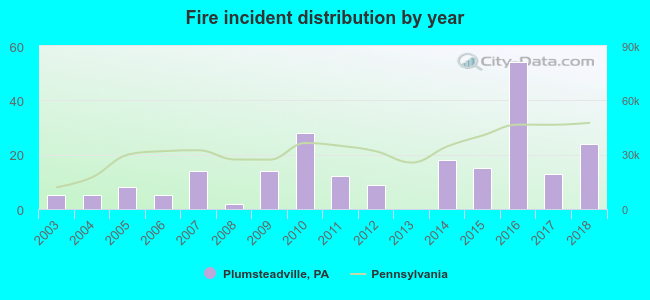 Based on the data from the years 2003 - 2018 the average number of fires per year is 14. The highest number of fires - 54 took place in 2016, and the least - 0 in 2013. The data has a rising trend.
 36.3% incidents where reported in the morning and 63.7% in the evening. The most fires (22.6%) took place on Tuesday, and the least (10.6%) on Wednesday.
 According to the 226 incident reports from years 2003 - 2018 most fires (17.7%) took place during June, and the least (3.1%) in March.
 Out of all 864 cases reported during the years 2003 - 2018, the most belonged to the categories: Fire (26.2%), Service Call (24.5%), and Good Intent Call (19.9%).
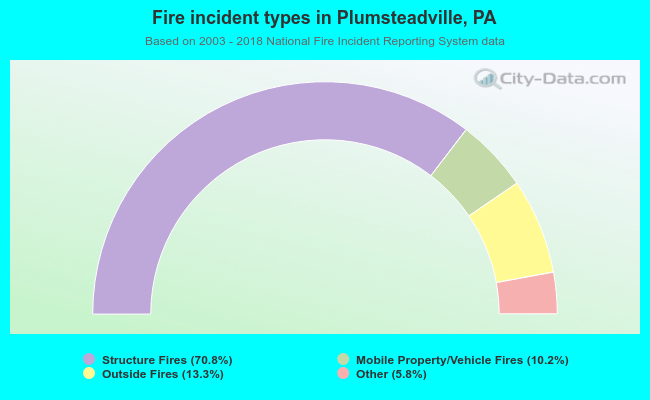 When looking into fire subcategories, the most reports belonged to: Structure Fires (70.8%), and Outside Fires (13.3%).