Pittsfield: Fire Incidents, Illinois (IL)
Where are fire incidents reported in Pittsfield, IL
Something went wrong! Please refresh the page.
|
| |||||||||||||||||||||||||||||||||||||||||||||||||||||||||||||||||||||||||||||||||||||||||||||||||||||||||||||
| Other | 73 | |||||||||||||||||||||||||||||||||||||||||||||||||||||||||||||||||||||||||||||||||||||||||||||||||||||||||||||
2002 - 2018 National Fire Incident Reporting System (NFIRS) incidents
- Incident types reported to NFIRS in Pittsfield, IL
- 53559.1%Fire
- 19821.9%Hazardous Condition
- 839.2%Good Intent Call
- 525.7%Rescue & EMS
- 273.0%False Alarm
- 91.0%Service Call
- 10.1%Overpressure Rupture
- 10.1%Severe Weather
- Fire incident types reported to NFIRS in Pittsfield, IL
- 23343.6%Outside Fires
- 20037.4%Structure Fires
- 9718.1%Mobile Property/Vehicle Fires
- 50.9%Other
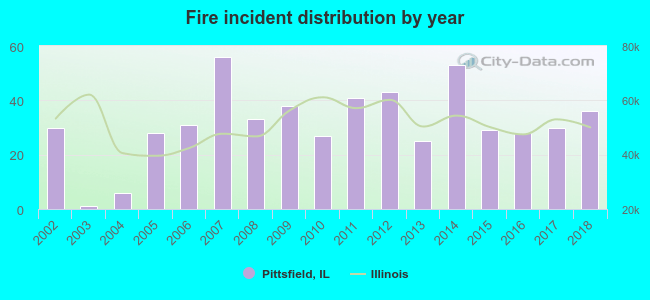 Based on the data from the years 2002 - 2018 the average number of fires per year is 31. The highest number of fire incidents - 56 took place in 2007, and the least - 1 in 2003. The data has a rising trend.
 The median response time based on all reported fire incidents is 8 minutes. This is higher compared to the Illinois median value.
The median response time in Pittsfield, IL compared to nearest cities:
(Note: Based on data for all years, including only cities with at least 500 fire incidents)
| Pittsfield: | 8 minutes |
| Jacksonville: | 4 minutes |
| Quincy: | 4 minutes |
 According to the reports from the years 2002 - 2018 the average number of fire-related fatalities per year is 0. The highest number of deaths - 1 took place in 2005, and the lowest - 0 in 2002. The data has a constant trend.
 29.3% incidents where reported in the morning and 70.7% in the evening. The most fires (17.2%) took place on Saturday, and the least (11.0%) on Tuesday.
 According to the 535 incident reports from years 2002 - 2018 most fires (14.6%) took place during March, and the least (4.9%) in May.
 Out of all 906 cases reported during the years 2002 - 2018, the most belonged to the categories: Fire (59.1%), Hazardous Condition (21.9%), and Good Intent Call (9.2%).
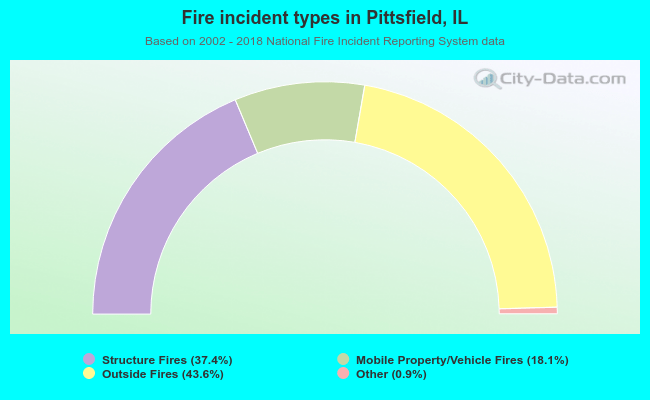 When looking into fire subcategories, the most reports belonged to: Outside Fires (43.6%), and Structure Fires (37.4%).