| Fire incidents reported |
|---|
| Sreet name | Count |
|---|
| BROADWAY BLVD | 60 | | WALL AVE | 36 | | BROADWAY | 28 | | 3RD ST | 20 | | 2ND ST | 18 | | BRINTON AVE | 18 | | THIRD ST | 16 | | 2ND. ST | 10 | | 3 RD ST | 10 | | 6TH ST | 10 | | CENTER AVE | 10 | | SECOND ST | 10 | | 4TH ST | 8 | | 5TH ST | 8 | | BROADWAY AVE | 8 | | 7TH ST | 6 | | 9TH ST | 6 | | ELEANOR ST | 6 | | 368 BROADWAY AVE. | 4 | | 431 AGATHA STREET | 4 | | 500 BLOCK 2ND STREET REAR | 4 | | 510 BROADWAY | 4 | | 916 BROADWAY AVE. | 4 | | AGATHA ST | 4 | | BRINTON | 4 |
| | | Fire incidents reported |
|---|
| Sreet name | Count |
|---|
| HIGHLAND AVE | 4 | | JEWEL WAY | 4 | | KENNEY AVE | 4 | | MERCHANTS ALY | 4 | | SEVENTH ST | 4 | | SHORT ST | 4 | | WALL | 4 | | 1108 WALL AVE. | 2 | | 11TH | 2 | | 288 MAGINNS AVE. | 2 | | 300 BLOCK THIRD STREET | 2 | | 348 2ND STREET REAR | 2 | | 3RD AND HIGHLAND AVE. | 2 | | 3RD STREET | 2 | | 400 BLOCK BROADWAY AVE | 2 | | 484 3RD STREET | 2 | | 5 TH ST | 2 | | 500 SECOND STREET | 2 | | 502 CENTER AVE. APT. 2 | 2 | | 537 10TH STREET | 2 | | 543 3RD. STREET APT. 3 | 2 | | 578 BROADWAY AVE. | 2 | | 5TH ST | 2 | | 5TH. STREET AND HIGHLAND. | 2 | | |
|
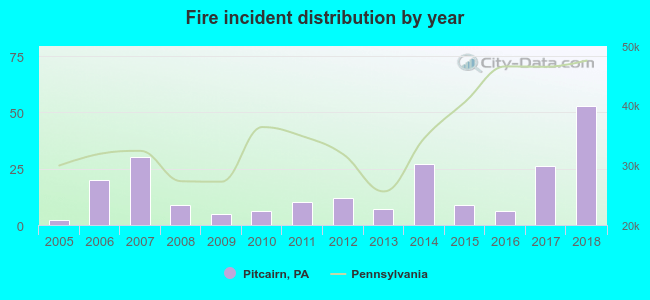 According to the data from the years 2005 - 2018 the average number of fire incidents per year is 16. The highest number of reported fire incidents - 53 took place in 2018, and the least - 2 in 2005. The data has a rising trend.
 44.1% incidents where reported in the morning and 55.9% in the evening. The most fires (21.2%) took place on Friday, and the least (9.0%) on Sunday.
 According to the 222 fire incidents from years 2005 - 2018 most fires (14.4%) took place during January, and the least (4.1%) in June.
 Out of all 778 cases reported during the years 2005 - 2018, the most belonged to the categories: Fire (28.5%), Hazardous Condition (26.0%), and Good Intent Call (18.6%).
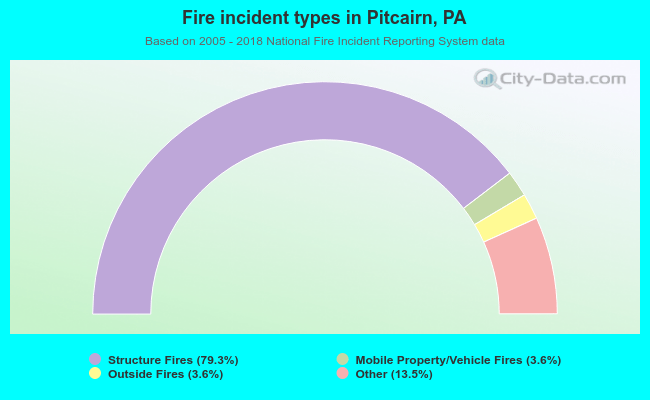 When looking into fire subcategories, the most incidents belonged to: Structure Fires (79.3%), and Other (13.5%).