| Fire incidents reported |
|---|
| Sreet name | Count |
|---|
| BEAR CREEK ROAD | 14 | | HIGHWAY 45 | 14 | | CEDARFIELD RD | 12 | | HWY 45 SOUTH | 10 | | OZIER ROAD | 10 | | BEAR CREEK RD | 8 | | GARLAND RD | 8 | | OZIER RD | 8 | | ALLEN RD | 6 | | DRY CREEK RD | 6 | | DRY CREEK RD. | 6 | | HARRISON LN | 6 | | PARKBURG ROAD | 6 | | SHORT ROAD | 6 | | YOUNG RD | 6 | | BEAR CREEK RD | 4 | | CARL MCGILL RD | 4 | | CEDARFIELD ROAD | 4 | | DIAMOND GROVE ROAD | 4 | | DRY CREEK LN | 4 | | GARLAND RD. | 4 | | HARTS BRIDGE ROAD | 4 | | MAYS CEMETARY ROAD | 4 | | MAYS CEMETERY ROAD | 4 | | MT PLEASANT ROAD | 4 |
| | | Fire incidents reported |
|---|
| Sreet name | Count |
|---|
| OLD HENDERSON ROAD | 4 | | ROBERTS ROAD | 4 | | WILDE ROAD | 4 | | BEAR CREEK RD | 2 | | BEAR CREEK | 2 | | BEAR CREEK RD. | 2 | | BEECH GROVE CHURCH RD | 2 | | CAIN RD | 2 | | CAIN RD | 2 | | CARL MCGILL | 2 | | CEDAR FIELD RD | 2 | | CHADWICK LN. | 2 | | DEANBURG RD. | 2 | | DIAMOND GROVE RD | 2 | | ENGLAND RD | 2 | | FRANK LATHAM RD | 2 | | FRANK LATHAM RD. | 2 | | HARTS BRIDGE ROAD | 2 | | HARTS BRIDGE RD | 2 | | HIGHWAY 45 SOUTH | 2 | | HIGHWAY 45 SOUTH BYP | 2 | | JULIAN LN. | 2 | | MAYS CEMTERY | 2 | | NEEDMORE RD | 2 | | OLD HENDERSON RD | 2 |
|
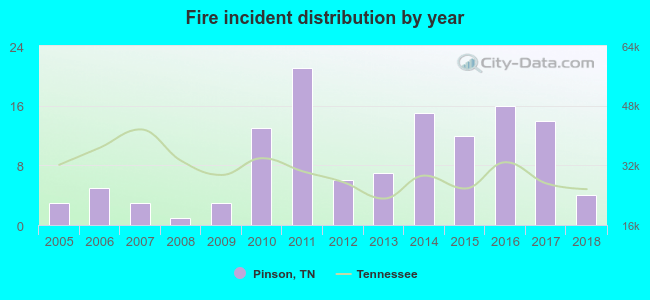 Based on the data from the years 2005 - 2018 the average number of fires per year is 9. The highest number of fire incidents - 21 took place in 2011, and the least - 1 in 2008. The data has an increasing trend.
 28.5% incidents where reported in the morning and 71.5% in the evening. The most fires (17.1%) took place on Tuesday, and the least (12.2%) on Monday.
 Based on the 123 fire incidents from years 2005 - 2018 most fires (15.4%) took place during January, and the least (0.8%) in August.
 Out of all 463 cases reported during the years 2005 - 2018, the most belonged to the categories: Overpressure Rupture (29.2%), Fire (26.6%), and Service Call (18.1%).
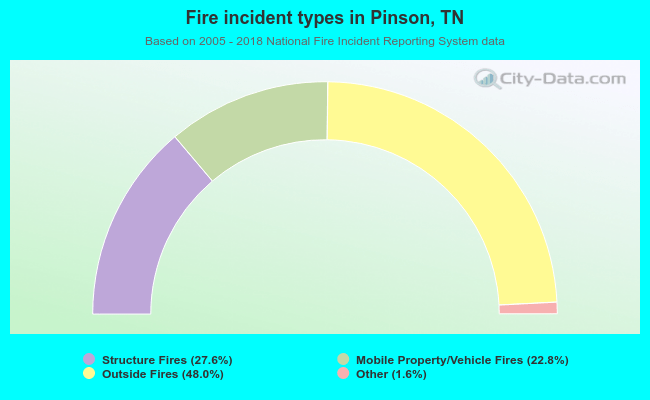 When looking into fire subcategories, the most incidents belonged to: Outside Fires (48.0%), and Structure Fires (27.6%).