| Fire incidents reported |
|---|
| Sreet name | Count |
|---|
| TULPEHOCKEN (58) ST | 28 | | SUEDBURG (21) RD | 16 | | DETURKSVILLE RD | 12 | | MOTTER (21) DR | 12 | | MAPLE ST | 10 | | OAK GROVE RD | 10 | | SNYDER AVE | 10 | | SWOPES VALLEY RD | 10 | | DAD BURNHAMS (33) RD | 8 | | DETURKSVILLE (33) RD | 8 | | PENN DYE ST | 8 | | SUEDBERG RD | 8 | | TREMONT RD | 8 | | BIRDS HILL (21) RD | 6 | | ELWOOD LN | 6 | | LAUREL (58) ST | 6 | | MOUNTAIN (33) RD | 6 | | MOUNTAIN RD | 6 | | SPRUCE ST | 6 | | SUEDBURG RD | 6 | | SWEET ARROW LAKE ST | 6 | | TREMONT (21) RD | 6 | | TULPEHOCKEN ST | 6 | | BIRDS HILL RD | 4 | | FELTY RD | 4 |
| | | Fire incidents reported |
|---|
| Sreet name | Count |
|---|
| FLAT HILL RD | 4 | | GEARY WOLF (21) RD | 4 | | HETZELS CHURCH (33) RD | 4 | | HIGH (58) ST | 4 | | INTERSTATE 81 | 4 | | INTERSTATE 81 SOUTH | 4 | | KEMMERLING (33) RD | 4 | | LAUREL ST | 4 | | LONG RUN (34) RD | 4 | | LONG STRETCH (21) RD | 4 | | MAPLE STREET | 4 | | MOLLEYSTOWN (29) RD | 4 | | MOUNTIAN | 4 | | ROCK RD | 4 | | SCHOOL ST | 4 | | STANHOPE RD | 4 | | STUMP (33) LA | 4 | | SUEDSBURG RD | 4 | | SWEET ARROW LAKE (33) RD | 4 | | SWEET ARROW LAKE RD | 4 | | VAUX (67) ST | 4 | | 10 SNYDER AVENUE | 2 | | 100 SUEDBURG ROAD | 2 | | 11 NATURE COURT | 2 | | 136 MOLLEYSTOWN RD | 2 |
|
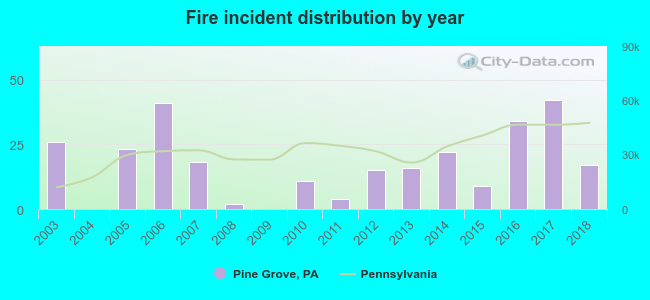 According to the data from the years 2003 - 2018 the average number of fire incidents per year is 18. The highest number of reported fires - 42 took place in 2017, and the least - 0 in 2004. The data has a declining trend.
 According to the data from the years 2003 - 2018 the average number of fire-related yearly casualties is 0. The highest number of casualties - 2 took place in 2003, and the lowest - 0 in 2004. The data has a dropping trend.
 36.4% incidents where reported in the morning and 63.6% in the evening. The most fires (21.4%) took place on Thursday, and the least (6.8%) on Tuesday.
 Based on the 280 fires from years 2003 - 2018 most fires (13.9%) took place during March, and the least (1.4%) in September.
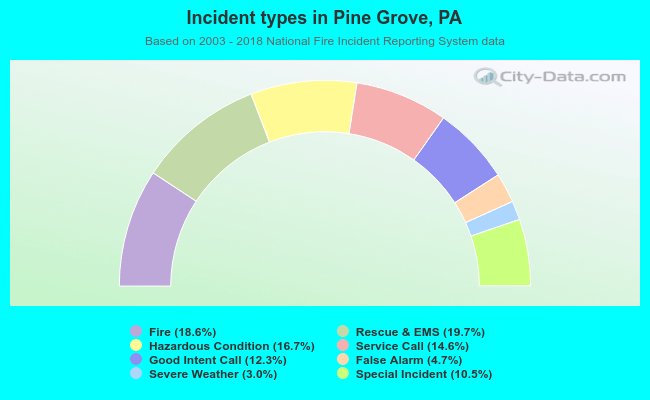 Out of all 1,509 cases reported during the years 2003 - 2018, the most belonged to the categories: Overpressure Rupture (19.7%), Fire (18.6%), and Rescue & EMS (16.7%).
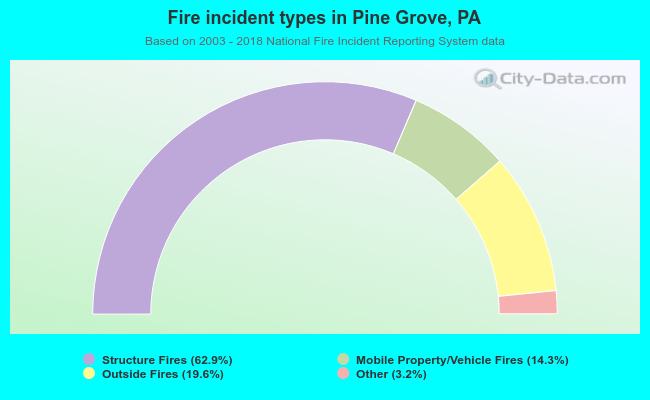 When looking into fire subcategories, the most reports belonged to: Structure Fires (62.9%), and Outside Fires (19.6%).