Philo: Fire Incidents, Illinois (IL)
Where are fire incidents reported in Philo, IL
Something went wrong! Please refresh the page.
|
| |||||||||||||||||||||||||||||||||||||||||||||||||||||||||||||||||||||||||||||||||||||||||||||||||||||||||||||
| Other | 13 | |||||||||||||||||||||||||||||||||||||||||||||||||||||||||||||||||||||||||||||||||||||||||||||||||||||||||||||
2002 - 2018 National Fire Incident Reporting System (NFIRS) incidents
- Incident types reported to NFIRS in Philo, IL
- 29551.0%Rescue & EMS
- 13323.0%Fire
- 5810.0%Hazardous Condition
- 356.1%Good Intent Call
- 295.0%Service Call
- 244.2%False Alarm
- 40.7%Severe Weather
- Fire incident types reported to NFIRS in Philo, IL
- 6145.9%Outside Fires
- 4936.8%Structure Fires
- 1914.3%Mobile Property/Vehicle Fires
- 43.0%Other
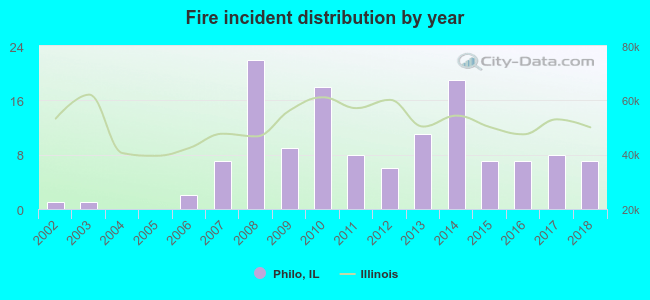 According to the data from the years 2002 - 2018 the average number of fires per year is 8. The highest number of fires - 22 took place in 2008, and the least - 0 in 2004. The data has an increasing trend.
 24.8% incidents where reported in the morning and 75.2% in the evening. The most fires (18.0%) took place on Wednesday, and the least (9.0%) on Sunday.
 Based on the 133 fire incidents from years 2002 - 2018 most fires (18.0%) took place during May, and the least (0.8%) in February.
 Out of all 578 cases reported during the years 2002 - 2018, the most belonged to the categories: Overpressure Rupture (51.0%), Fire (23.0%), and Rescue & EMS (10.0%).
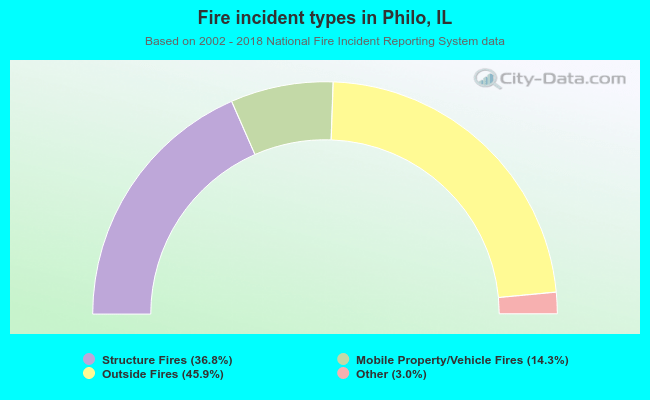 When looking into fire subcategories, the most incidents belonged to: Outside Fires (45.9%), and Structure Fires (36.8%).