| Fire incidents reported |
|---|
| Sreet name | Count |
|---|
| STATE ST | 32 | | MAIN ST | 28 | | POPLAR ST | 22 | | NORTH ST | 10 | | PANSING RD | 8 | | SWEET POTATO RIDGE RD | 8 | | DAYTON GREENVILLE PIKE | 6 | | MAIN ST | 6 | | WENGERLAWN RD | 6 | | BROOKVILLE PHILLIPSBURG RD | 4 | | MILAN ST | 4 | | N STATE ST | 4 | | PANSING | 4 | | ST. RT. 49 | 4 | | STATE ROUTE 49 HWY | 4 | | 49 RT | 2 | | ARLINGTON RD | 2 | | BAKER LN | 2 | | BALTIMORE PHILLIPSBURG RD | 2 | | BLANK RD | 2 | | DAYTON GREENVILLE PIKE | 2 | | DIAMOND MILL RD | 2 | | E. MAIN ST. | 2 | | ELM ST | 2 | | FERNWOOD AV | 2 |
| | | Fire incidents reported |
|---|
| Sreet name | Count |
|---|
| GETTER LN | 2 | | GRUBBS REX RD | 2 | | HARTMAN RD | 2 | | HOLDERMAN | 2 | | KEMPLE RD. | 2 | | LUDLOW ST | 2 | | LUTHERAN RD | 2 | | MILAN | 2 | | MILLARD RD | 2 | | MONTGOMERY COUNTY LINE | 2 | | NATIONAL RD | 2 | | OAKES RD | 2 | | PARK DR | 2 | | PHILLIPSBURG RD | 2 | | PHILLIPSBURG UNION | 2 | | PHILLIPSBURG UNION RD | 2 | | PHILLIPSBURG-UNION RD | 2 | | PLEASANT PLAIN RD | 2 | | ROSEWOOD DR | 2 | | RT 49 | 2 | | SR 49 | 2 | | ST RT 721 | 2 | | STE. RTE. 49 | 2 | | SWEET POTATO RG. RD | 2 | | SWEET POTATO RIDGEPHBG RD | 2 |
|
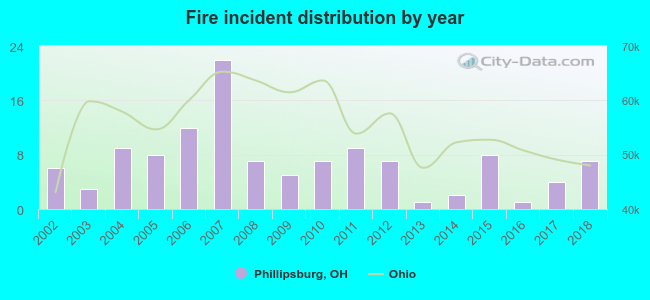 Based on the data from the years 2002 - 2018 the average number of fires per year is 7. The highest number of reported fire incidents - 22 took place in 2007, and the least - 1 in 2013. The data has an increasing trend.
 31.4% incidents where reported in the morning and 68.6% in the evening. The most fires (21.2%) took place on Sunday, and the least (9.3%) on Tuesday.
 Based on the 118 fires from years 2002 - 2018 most fires (16.9%) took place during October, and the least (4.2%) in January.
 Out of all 602 cases reported during the years 2002 - 2018, the most belonged to the categories: Rescue & EMS (49.0%), Hazardous Condition (20.9%), and Fire (19.6%).
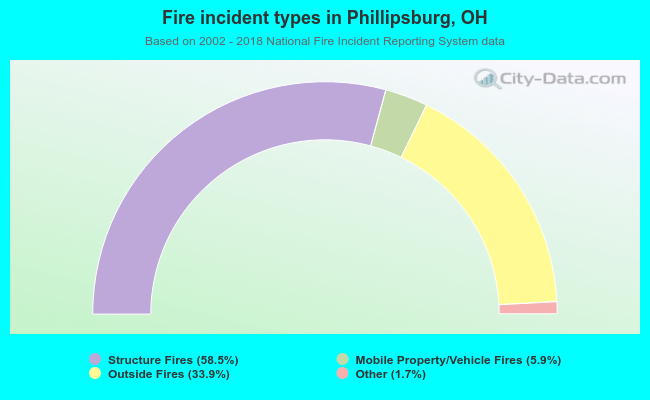 When looking into fire subcategories, the most incidents belonged to: Structure Fires (58.5%), and Outside Fires (33.9%).