Perry: Fire Incidents, New York (NY)
Where are fire incidents reported in Perry, NY
Something went wrong! Please refresh the page.
|
| |||||||||||||||||||||||||||||||||||||||||||||||||||||||||||||||||||||||||||||||||||||||||||||||||||||||||||||
2002 - 2018 National Fire Incident Reporting System (NFIRS) incidents
- Incident types reported to NFIRS in Perry, NY
- 65444.4%Hazardous Condition
- 22815.5%Rescue & EMS
- 17311.7%False Alarm
- 16110.9%Good Intent Call
- 14810.0%Fire
- 825.6%Service Call
- 271.8%Severe Weather
- Fire incident types reported to NFIRS in Perry, NY
- 10369.6%Structure Fires
- 3423.0%Outside Fires
- 74.7%Mobile Property/Vehicle Fires
- 42.7%Other
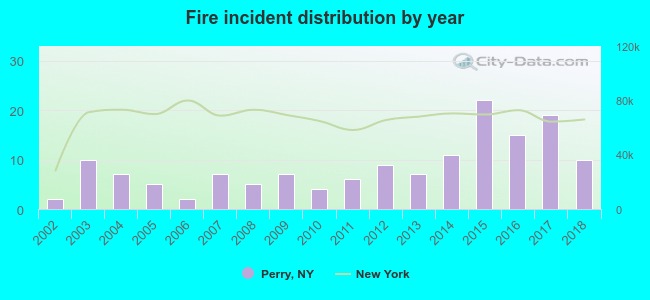 According to the data from the years 2002 - 2018 the average number of fires per year is 9. The highest number of reported fires - 22 took place in 2015, and the least - 2 in 2002. The data has a growing trend.
 29.7% incidents where reported in the morning and 70.3% in the evening. The most fires (20.3%) took place on Tuesday, and the least (10.8%) on Sunday.
 According to the 148 incident reports from years 2002 - 2018 most fires (12.8%) took place during May, and the least (5.4%) in January.
 Out of all 1,474 cases reported during the years 2002 - 2018, the most belonged to the categories: Rescue & EMS (44.4%), Overpressure Rupture (15.5%), and Good Intent Call (11.7%).
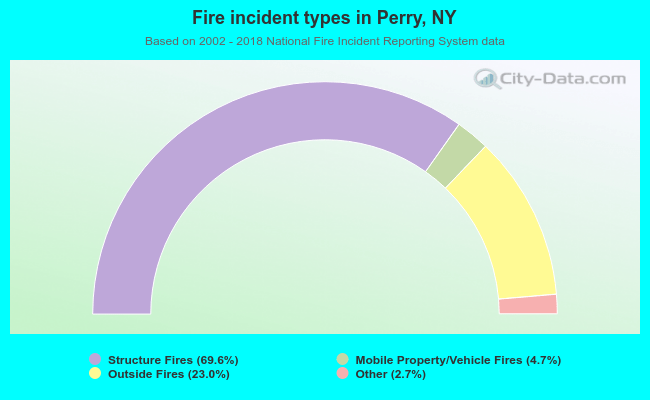 When looking into fire subcategories, the most incidents belonged to: Structure Fires (69.6%), and Outside Fires (23.0%).