Perry Hall: Fire Incidents, Maryland (MD)
Where are fire incidents reported in Perry Hall, MD
Something went wrong! Please refresh the page.
|
| |||||||||||||||||||||||||||||||||||||||||||||||||||||||||||||||||||||||||||||||||||||||||||||||||||||||||||||
2003 - 2018 National Fire Incident Reporting System (NFIRS) incidents
- Incident types reported to NFIRS in Perry Hall, MD
- 2,74775.9%Rescue & EMS
- 3259.0%Hazardous Condition
- 1604.4%Fire
- 1574.3%Good Intent Call
- 1103.0%False Alarm
- 1093.0%Service Call
- 60.2%Overpressure Rupture
- Fire incident types reported to NFIRS in Perry Hall, MD
- 7446.3%Outside Fires
- 5936.9%Structure Fires
- 2213.8%Mobile Property/Vehicle Fires
- 53.1%Other
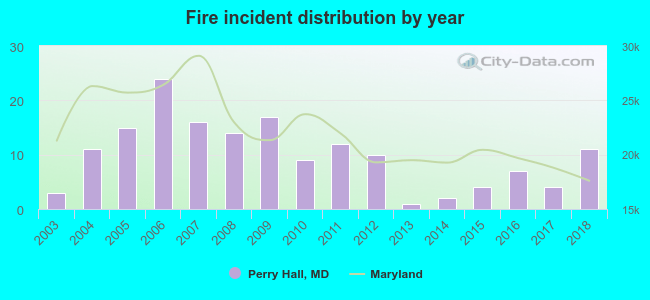 Based on the data from the years 2003 - 2018 the average number of fires per year is 10. The highest number of fire incidents - 24 took place in 2006, and the least - 1 in 2013. The data has a rising trend.
The average number of yearly fire incidents per 10k residents in Perry Hall, MD compared to nearest cities:
(Note: Based on data for the last 3 years, including only cities with population 5,000 and above)
| Perry Hall: | 2.6 |
| White Marsh: | 31.9 |
| Parkville: | 23.6 |
| Middle River: | 43.3 |
| Rosedale: | 19.7 |
| Essex: | 24.5 |
| Towson: | 13.6 |
| Fallston: | 44.7 |
| Cockeysville: | 26.3 |

 28.1% incidents where reported in the morning and 71.9% in the evening. The most fires (21.3%) took place on Saturday, and the least (10.0%) on Thursday.
 According to the 160 fires from years 2003 - 2018 most fires (13.1%) took place during July, and the least (5.0%) in October.
 Out of all 3,618 cases reported during the years 2003 - 2018, the most belonged to the categories: Rescue & EMS (75.9%), Hazardous Condition (9.0%), and Fire (4.4%).
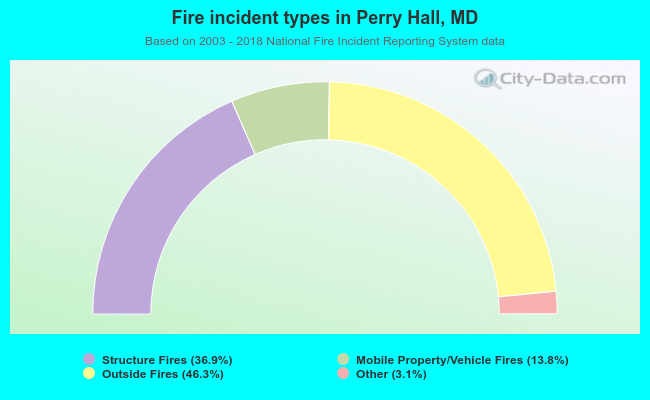 When looking into fire subcategories, the most incidents belonged to: Outside Fires (46.3%), and Structure Fires (36.9%).