Perris: Fire Incidents, California (CA)
Where are fire incidents reported in Perris, CA
Something went wrong! Please refresh the page.
|
| |||||||||||||||||||||||||||||||||||||||||||||||||||||||||||||||||||||||||||||||||||||||||||||||||||||||||||||
| Other | 11 | |||||||||||||||||||||||||||||||||||||||||||||||||||||||||||||||||||||||||||||||||||||||||||||||||||||||||||||
2006 - 2018 National Fire Incident Reporting System (NFIRS) incidents
- Incident types reported to NFIRS in Perris, CA
- 24746.4%Fire
- 20137.8%Rescue & EMS
- 397.3%Good Intent Call
- 224.1%Service Call
- 142.6%Hazardous Condition
- 91.7%False Alarm
- Fire incident types reported to NFIRS in Perris, CA
- 15261.5%Outside Fires
- 4819.4%Mobile Property/Vehicle Fires
- 3915.8%Structure Fires
- 83.2%Other
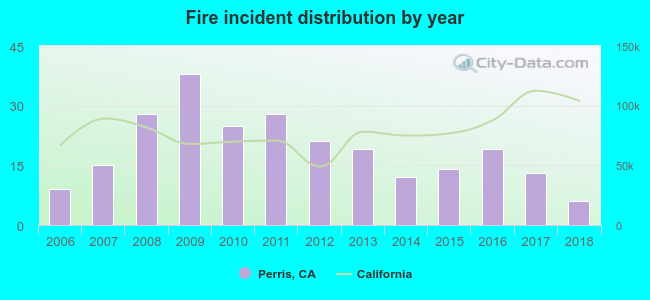 Based on the data from the years 2006 - 2018 the average number of fire incidents per year is 19. The highest number of fire incidents - 38 took place in 2009, and the least - 6 in 2018. The data has a declining trend.
The average number of yearly fire incidents per 10k residents in Perris, CA compared to nearest cities:
(Note: Based on data for the last 3 years, including only cities with population 5,000 and above)
| Perris: | 1.7 |
| Good Hope: | 1.1 |
| Mead Valley: | 0.5 |
| Nuevo: | 3.9 |
| Sun City: | 0.4 |
| Menifee: | 1.0 |
| Homeland: | 3.4 |
| Canyon Lake: | 1.4 |
| Moreno Valley: | 0.6 |

 24.7% incidents where reported in the morning and 75.3% in the evening. The most fires (18.6%) took place on Saturday, and the least (10.9%) on Tuesday.
 Based on the 247 fire incidents from years 2006 - 2018 most fires (13.4%) took place during June, and the least (5.7%) in November.
 Out of all 532 cases reported during the years 2006 - 2018, the most belonged to the categories: Fire (46.4%), Overpressure Rupture (37.8%), and Service Call (7.3%).
 When looking into fire subcategories, the most reports belonged to: Outside Fires (61.5%), and Mobile Property/Vehicle Fires (19.4%).