| Fire incidents reported |
|---|
| Sreet name | Count |
|---|
| ALMOND ST | 10 | | COOLIE BOTTOM RD | 6 | | GOLDFISH RD | 6 | | PINE ST | 6 | | 105 SOUTH BROWN STREET | 4 | | 201 SHORT AVE | 4 | | 2ND ST | 4 | | 4 RT | 4 | | 602 EAST ALMOND | 4 | | CHESTNUT | 4 | | CHESTNUT ST | 4 | | COOLIE BOTTOM ROAD | 4 | | COUNTY LINE | 4 | | E. PINE | 4 | | MINTON DR | 4 | | MINTON DRIVE | 4 | | PEG ST | 4 | | PERCY RD | 4 | | PINE | 4 | | PYATT/CUTLER RD | 4 | | PYATTCUTLER ROAD | 4 | | RALPH ST | 4 | | 1002 W PINE | 2 | | 101 HUSKY RUN RUN | 2 | | 11256 COOLEY BOTTOM RD | 2 |
| | | Fire incidents reported |
|---|
| Sreet name | Count |
|---|
| 12464 BLACKSTUMP RD | 2 | | 13520 COMUNITY LAKE RD LOT 762 RD | 2 | | 13520 COUMINUTY LAKE ROAD LOT5 | 2 | | 1502 EAST PINE ST | 2 | | 17 A WEST PEG STREET | 2 | | 201 SOUT MINTON DR DR | 2 | | 201 SOUTH PARK CT | 2 | | 201 SOUTH PARK COURT | 2 | | 204 E. PINE ST. | 2 | | 204 EAST PINE | 2 | | 30 SOUTH SECOND STREET | 2 | | 309 WEST ALMOND | 2 | | 402 EAST CHESTNUT ST | 2 | | 403 E ALLEY 1 | 2 | | 403 SOUTH PARK COURT | 2 | | 408 WEST PLUM | 2 | | 410 WEST CHESTNUT | 2 | | 418 HARBOR POINT | 2 | | 500 CUTLER TRICO RD | 2 | | 507 EAST PINE | 2 | | 5106 PERCY ROAD | 2 | | 5145 PERCY RD | 2 | | 6004 MEYERS LANE | 2 | | 601 W PINE ST | 2 | | |
|
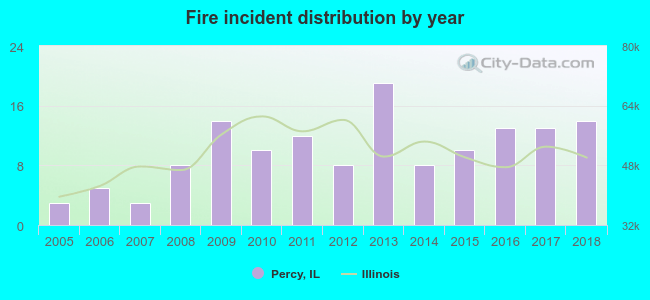 According to the data from the years 2005 - 2018 the average number of fires per year is 10. The highest number of fires - 19 took place in 2013, and the least - 3 in 2005. The data has an increasing trend.
 35.0% incidents where reported in the morning and 65.0% in the evening. The most fires (17.1%) took place on Tuesday, and the least (12.1%) on Wednesday.
 Based on the 140 fire incidents from years 2005 - 2018 most fires (16.4%) took place during February, and the least (3.6%) in November.
 Out of all 536 cases reported during the years 2005 - 2018, the most belonged to the categories: Rescue & EMS (64.0%), Fire (26.1%), and Good Intent Call (3.9%).
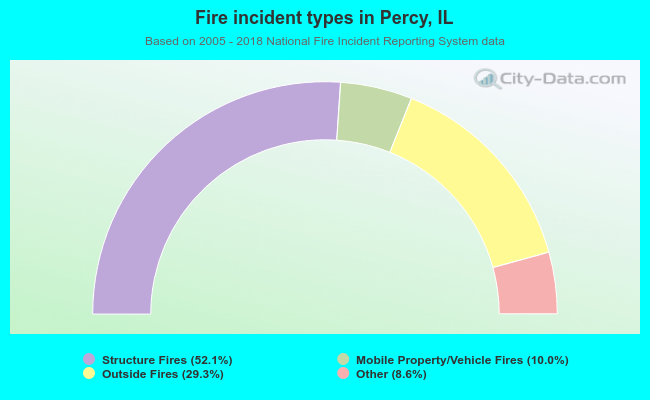 When looking into fire subcategories, the most incidents belonged to: Structure Fires (52.1%), and Outside Fires (29.3%).