Pembroke: Fire Incidents, New York (NY)
Where are fire incidents reported in Pembroke, NY
Something went wrong! Please refresh the page.
|
| |||||||||||||||||||||||||||||||||||||||||||||||||||||||||||||||||||||||||||||||||||||||||||||||||||||||||||||
2002 - 2018 National Fire Incident Reporting System (NFIRS) incidents
- Incident types reported to NFIRS in Pembroke, NY
- 1,58261.6%Rescue & EMS
- 2409.3%Fire
- 2349.1%Service Call
- 1807.0%Good Intent Call
- 1666.5%False Alarm
- 1465.7%Hazardous Condition
- 100.4%Special Incident
- 80.3%Severe Weather
- Fire incident types reported to NFIRS in Pembroke, NY
- 11347.1%Structure Fires
- 6627.5%Mobile Property/Vehicle Fires
- 3815.8%Outside Fires
- 239.6%Other
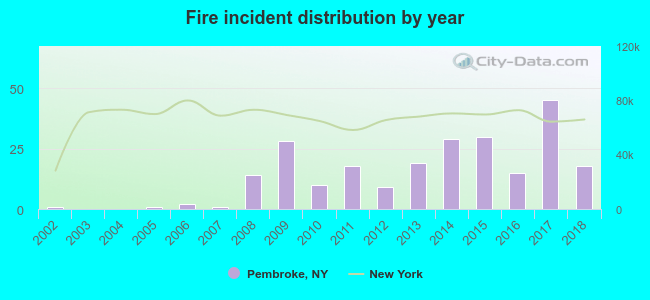 According to the data from the years 2002 - 2018 the average number of fires per year is 14. The highest number of reported fires - 45 took place in 2017, and the least - 0 in 2003. The data has a growing trend.
 27.9% incidents where reported in the morning and 72.1% in the evening. The most fires (18.8%) took place on Thursday, and the least (12.1%) on Wednesday.
 According to the 240 incident reports from years 2002 - 2018 most fires (12.1%) took place during May, and the least (5.0%) in June.
 Out of all 2,567 cases reported during the years 2002 - 2018, the most belonged to the categories: Rescue & EMS (61.6%), Fire (9.3%), and Service Call (9.1%).
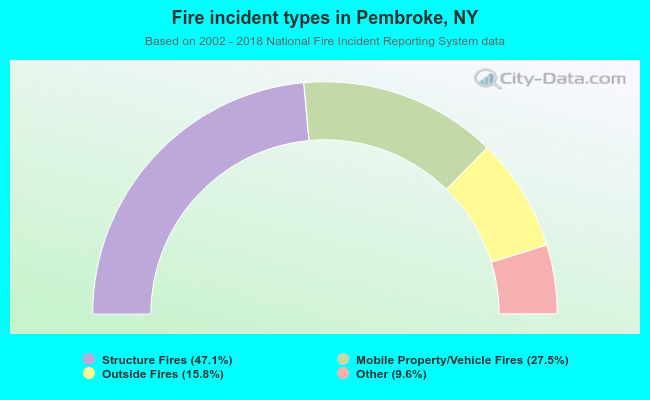 When looking into fire subcategories, the most incidents belonged to: Structure Fires (47.1%), and Mobile Property/Vehicle Fires (27.5%).